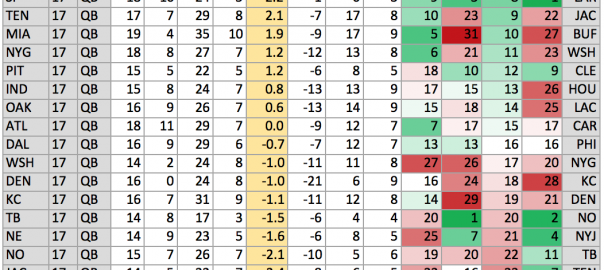
Fantasy Points Above Expectation (FPAE) is a metric we created to better capture how much fantasy production each team is giving up. FPAE measures how many fantasy points a team gives up to each position relative to what their opponents had averaged going into each matchup. For example, if GB’s FPAE against QBs is 5.0, that means they have given up an average of 5 points more than expected to QBs. In this context, “expected” is referring to their opponents’ average fantasy points heading into the matchup. We give a detailed explanation of FPAE here. FPAE values for each position group are shown below and were calculated using each team’s last 7 games (PPR scoring).
Continue reading Fantasy Points Above Expectation (FPAE)
NBA Elo Ratings and Simulation
Below is a table of our NBA Elo ratings for the 2018-2019 season along with win totals and playoff probabilities derived from 500 simulations of the 2018-2019 season. Check back over the course of the season as we will continue to update our elo ratings, along with win projections and playoff probabilities.
Elo ratings are a zero-sum rating system where teams are rewarded points after a win and subtracted points after a loss. The magnitude of this adjustment is larger for more unexpected outcomes. For instance, the Golden State Warriors would not receive much of a boost in their elo if they beat the Phoenix Suns because this is what we would expect to happen, but the Phoenix Suns would receive a larger increase in their elo if they managed to upset the Warriors. At Model284, our elos take into account each team’s prior elo rating, margin of victory, home court advantage, and the number of days off for each team prior to the game. Elo ratings do not immediately adjust for injuries, or roster changes from free agency and trades.
Team | Elo | Wins | Playoff Probability |
---|---|---|---|
Milwaukee Bucks | 1744 | 60.8 | >0.99 |
Golden State Warriors | 1706 | 56.7 | >0.99 |
Houston Rockets | 1706 | 52.6 | >0.99 |
Portland Trail Blazers | 1675 | 52.2 | >0.99 |
Toronto Raptors | 1658 | 57.3 | >0.99 |
Utah Jazz | 1649 | 50.2 | >0.99 |
Philadelphia 76ers | 1646 | 53.2 | >0.99 |
Denver Nuggets | 1629 | 54.1 | >0.99 |
Los Angeles Clippers | 1598 | 49.2 | >0.99 |
San Antonio Spurs | 1596 | 47.3 | >0.99 |
Orlando Magic | 1574 | 41 | 0.83 |
Oklahoma City Thunder | 1542 | 46.5 | >0.99 |
Detroit Pistons | 1541 | 42.7 | 0.99 |
Boston Celtics | 1528 | 47.5 | >0.99 |
Indiana Pacers | 1517 | 47.9 | >0.99 |
Miami Heat | 1515 | 40.3 | 0.42 |
Brooklyn Nets | 1495 | 40.9 | 0.75 |
Los Angeles Lakers | 1469 | 36.5 | <0.01 |
Minnesota Timberwolves | 1459 | 36.6 | <0.01 |
Sacramento Kings | 1457 | 40.3 | <0.01 |
Charlotte Hornets | 1453 | 37.2 | 0.01 |
Washington Wizards | 1414 | 34.4 | <0.01 |
Atlanta Hawks | 1373 | 29.1 | <0.01 |
Memphis Grizzlies | 1372 | 32.5 | <0.01 |
New Orleans Pelicans | 1365 | 33.5 | <0.01 |
Dallas Mavericks | 1360 | 32.7 | <0.01 |
Chicago Bulls | 1302 | 22.8 | <0.01 |
Cleveland Cavaliers | 1293 | 20.4 | <0.01 |
Phoenix Suns | 1201 | 18.3 | <0.01 |
New York Knicks | 1175 | 15.4 | <0.01 |
*Last update on April 1st.
A Non Model Based Minnesota Wild Season Preview
Okay Wild fans it’s that time of year. The time of year where we look at our roster, put on a brave face, and convince ourselves that this team can win a playoff series. Will it happen? Almost certainly not, but Marian Gaborik ain’t walking through that door any time soon, so we might as well reach deep into our hearts and minds and force ourselves to believe that we have enough talent up front to be a relevant NHL team in the 2018-2019 season. Is our top returning goal scorer turning 34 this month? Maybe he is, maybe he’s not. Age is just a number. Is the average age of our top two centers over 34? See above answer. Do we have almost exactly the same team we’ve had for the last six years? The team that has made it to the playoffs each of those last six years and won two playoff series? More or less, yes we do. None of this sounds good on paper, but as Minnesota Sports Fans it is our duty to ignore all signs of disaster and forge ahead with the most positive, if not delusional outlook we can manage. The general consensus amongst hockey pundits and fans is that the Wild will be one of, if not the, most boring team this year–and honestly, I don’t disagree. There is nothing about the Wild that screams “must watch.” Their best players aren’t exactly show stoppers. The closest things they have to gamebreakers are probably Zucker and Granlund and there are about 15 guys in the Central Division alone that I’d rather watch in a vacuum than those two. I don’t think anyone is paying top dollar to watch Koivu and Staal slow the game down (although Stubhub shows otherwise) and Suter might be the hardest top tier defensemen to watch in NHL history. It’s the same goddamn team they’ve trotted out for the last six years for christ’s sake. Sure those six years have all been playoff years but there is absolutely nothing about this team that should make anyone expect a legitimate playoff run this year. That being said, the Wild should be competitive in a very deep Central division. They don’t have the dynamic players that some of the top end teams have but they have a shit ton of depth at forward and defense and they’re experienced in terms of regular season success, so who the hell knows. They only thing I know for sure is that it’s going to be a long, long season, regardless of whether it ends after 82 games, or like 87 games… Continue reading A Non Model Based Minnesota Wild Season Preview
Hammer The Over: Minnesota Sports Therapy Session
It’s a Minnesota sports therapy session of hammer the over. Evan and Fred discuss the dismal performance against the Bills, Eversons wild Saturday, and Jimmy forcing himself out of Minnesota.
Podcast: Play in new window | Download
Hammer The Over: the Boys are Back, and so is Football
The Boys return from their summer hiatus just in time for Football season to get underway. With a pivotal matchup in Green Bay for Week 2, the guys discuss their first glance of the new look Vikings under Kirk Cousins, and set expectations for the early matchup with Aaron Rodgers and the mouth breathing Packers fans behind him. Did one of the HTO guys predict a tie in Green Bay?? Listen and find out…
2018 Fantasy Football Rankings
FOOTBALL IS FINALLY BACK! And since there is such a shortage of Fantasy Football content out there, we thought we needed to give the people some material to prepare for their drafts. The following rankings are loosely based on model predictions for each position, which use historical player/team data to predict fantasy points for the coming season (i.e., separate models for QB, RB, WR, TE, K, DST). That said, there are plenty of factors that any model will have trouble capturing perfectly (injury status, team depth charts, suspensions, QB/Coach changes, etc.), and thus we have made some subjective adjustments to the rankings where necessary. For example, if a model weighs last year’s cumulative statistics too heavily, Odell Beckham Jr. is not going to come out very high since he only played 4 games. Our rankings can be found below, along with a short description of the model we used for each position. All rankings reflect PPR scoring.
To download our rankings, click here Continue reading 2018 Fantasy Football Rankings
My Model Monday: Hockey Aging Curves
In this week’s My Model Monday, I explored aging curves in not just the NHL, but in other professional leagues and junior hockey leagues. First and foremost, what are aging curves? Aging curves are just what they sound like: curves that associate player performance and health over time. For a point of reference, despite his mighty accomplishments at an old age, Jaromir Jagr saw his point production dip from over a point per game at age 25 to about 0.3 PTS/G at age 45. Jaromir Jagr is an incredibly interesting case and likely outlier, as few players have played into their mid-forties. At any rate, one can imagine that many players experience similar increases and decreases in production with age; therefore, using many samples of players, one can construct a curve that resembles a mean of all players aging, or, as we like to say in the reinsurance industry, an industry exposure curve. Continue reading My Model Monday: Hockey Aging Curves
My Model Monday: Modeling NFL Injuries
Injuries are inevitable in a game as physical as NFL football. Every season, numerous star players and important contributors are sidelined, leaving their fans and fantasy owners disappointed. Injuries appear to strike at random; an elite athlete can have his knee blown out in one cut like Dalvin Cook last season. However, is there a way to identify if certain players are more injury prone than others? I dug into the data to find out how well we can predict injuries among skill position players in the NFL.
Continue reading My Model Monday: Modeling NFL Injuries
My Model Monday: NFL Coaches Exceeding Win Totals
Every year in the barren wasteland of the NFL offseason, pre-season win totals are set by oddsmakers for each team, serving as a rough expectation for how many games a given team will win in the coming season (e.g., the New England Patriots currently have a win total of 11 for 2018). I took a look at how coaches have performed against those pre-season expectations, with the idea being that a “successful” season is one in which they exceeded their expected wins. As an example, the 2017 Los Angeles Rams had a pre-season win total of 6, but ended up winning 11 games, so that gives a +5 mark for 1st-year head coach Sean McVay. For coaches with multiple seasons under their belt, we can do that calculation for every season and roll-up the results to give a view of how a given coach has performed against expectations over a long period of time.
Continue reading My Model Monday: NFL Coaches Exceeding Win Totals
NHL Draft Model Results 2018 (Preliminary)
Below is results to our (preliminary) NHL Draft Model that uses prospects’ statistical production, physical measurements, and other variables to predict the likelihood that a players assume a specific NHL Role (i.e., First Line / Top Pair, Second / Third Line / 2nd pair defensemen, Fourth Line / Bottom pair defensemen, and Non-NHL player). The model is still being fine-tuned, hence the preliminary results, and an in-depth methodology article will come in the future. In addition to the aforementioned role probabilities, there is also a predicted NHL point per game that is derived from our Hockey Translation Factors.