On Sunday, the NFL ended its season with the Super Bowl. As soon as tomorrow, pitchers and catchers will report to Florida or Arizona to begin spring training. And in Minneapolis as I type this, it’s a balmy 42 degrees. I have no doubt that we haven’t seen the last of this Minnesota winter, but nonetheless, I’ll take it as a sign that it’s time to turn our attention to baseball. So let’s talk about pitchers.
One of the joys of baseball is the mental game pitchers play in trying to outscheme opposing batters. For a young Little Leaguer, this might mean screwing up his face really hard, pretending to harness maximum effort, before lobbing a changeup toward the plate. As that player gets a little older, he’ll likely serve up a steady stream of fastballs until he gets to a 0-2 count, where he’ll always throw a curveball. But in the big leagues, pitchers are much more complex, mixing fastballs and offspeed pitches in all counts to keep hitters off-balance.
Who mixes pitches the best? Here’s one way of looking at it: a master pitch-mixer will not be afraid to throw fastballs or offspeed pitches in any count. Moreover, his fastball-offspeed ratio will remain similar no matter the count, so the hitter can’t use the count as a clue to sit on a certain pitch.
Using this concept, I developed a simple measure to quantify pitch mixing. I’m calling it a Pitcher Count Predictivity Score (or PCPS). To calculate a pitcher’s PCPS, I first calculate the percentage of pitches he threw in each count that were offspeed. I also calculate an overall offspeed percentage, which is equal to the mean of his offspeed percentages in each count, weighted by how often that count occurred in the majors overall.1 Then, for each count, I calculated how much the pitcher’s offspeed percentage in that count deviated from his overall offspeed percentage. His final mixing score is the average of these differences, weighted by how frequently the respective counts occur in the MLB overall.
Thus, if a pitcher’s offspeed percentage varies widely based what count he’s in, his Pitcher Count Predictivity Score will be higher, indicating that different counts are clues to be ready for different pitches. On the other hand, a lower score indicates more even pitch-mixing.
Here are the lowest PCPS scores from the 2016 season (among pitchers with at least 1,500 pitches thrown):
| Pitcher | PCPS |
|---|---|
| Johnny Cueto | 0.017 |
| Bartolo Colon | 0.019 |
| Jeff Samardzija | 0.025 |
| Kendall Graveman | 0.027 |
| Chris Tillman | 0.028 |
And the highest:
| Pitcher | PCPS |
|---|---|
| Clayton Kershaw | 0.162 |
| Jaime Garcia | 0.160 |
| James Shields | 0.152 |
| Aaron Sanchez | 0.150 |
| Danny Salazar | 0.148 |
Clearly, there are good pitchers on both lists. Johnny Cueto and Clayton Kershaw, tied for fourth among pitchers with 5.6 WAR in 2016 according to Baseball Reference, are on complete opposite ends of the list. Digging into their offspeed percentages by count, it’s clear why.
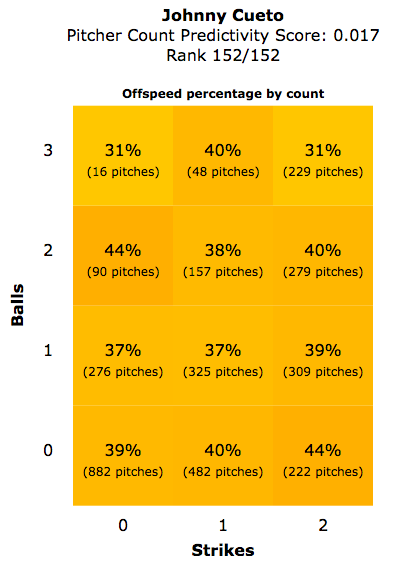
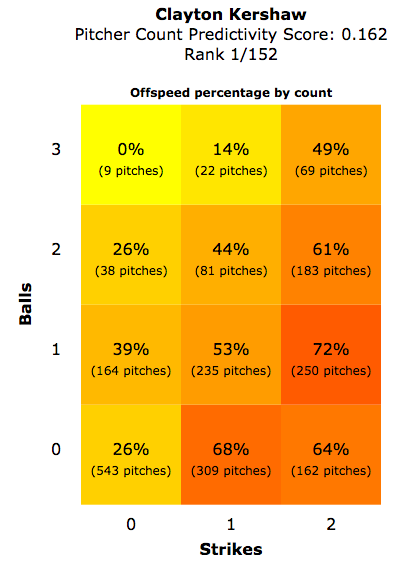
Cueto is a purer pitch-mixer, generally throwing his changeup or slider between 35% and 45% of the time no matter the count. Kershaw, on the other hand, clearly likes to get ahead of hitters with fastballs before finishing them off with his huge curveball. (To see a similar plot for any qualified pitcher, see our PCPS Viewer!)
One caveat to the mixing score: this metric treats all offspeed pitches—curveball, changeup, slider, etc.—and all fastballs—four-seam, two-seam, cutter, sinker—the same. Obviously some mixing happens within these categories, which the mixing score doesn’t capture. For example, Cueto makes use of a four-seamer, a two-seamer, and a cutter, which he mixes in slightly different proportions based on count.
Nonetheless, this mixing score offers a look at how different pitchers approach at-bats. For a hitter, this could be helpful in advance scouting. If you’re going up against a pitch-mixer like Johnny Cueto, there’s not much to gain from examining his pitch tendencies by count. Your time would be better spent looking for patterns elsewhere: research how he mixes his three fastballs, say, or whether his offspeed percentage is related to how many times he does his trademark shimmy.
On the other hand, if you’re facing someone like Clayton Kershaw, a high mixing score is a hint that there’s more value in digging deeper into his pitch distribution by count. Then if you find yourself at 1 and 2, you can prime yourself to look for a breaking ball, in hopes that it won’t catch you off guard.
As far as actually hitting it when you get it, you’re on your own.
Footnotes
- This is slightly different than a pitcher’s raw offspeed percentage. Think of it as what his overall offspeed percentage would be if he ended up in each count as often as the average pitcher. I calculated it in this way because better pitchers tend to throw more pitches in better counts, which could skew their overall offspeed percentage. This metric is a measure of mixing, not ability.^
Code for this article can be found at my Github page.