Preface
First and foremost, I regret to inform you that this analysis is NOT done with player tracking data.
Secondly, I want to say this lineup metric is called spacing, but it is not really a measure of spacing; it is more a measure of how capable a lineup is of producing efficient shots. So, why call it spacing? Firstly, because spacing is catchy and trendy, but also because we believe that when the average fan thinks or hears the word spacing, they are generally thinking about maximizing the optimal shots in basketball: three-pointers and shots at the rim.
Lastly, as with most components of our NBA Lineup Evaluator Tool, this research project is approached more from an intuition-meets-statistics perspective; where we use basketball theory to build a calculation and then test its relevance and importance.
Introduction
In today’s small-ball, three-point shooting era of basketball, we so often discuss the idea of “spacing” the court on offense. Often this is used by NBA Twitter to hate on lineups where two so-called “traditional” bigs are used (e.g. Gorgui Dieng / Taj Gibson and Karl-Anthony Towns). This “spacing” concept has been generated from the evolution of basketball analytics—I hate that word—where the most efficient shots are at the rim and behind the arc. Often the simplest way to generate these shots is out of a pick-and-roll scheme of sorts; this involves a player such as James Harden, LeBron James, or Jimmy Butler handling the ball, a big man in the mold of DeAndre Jordan as the roll man, and three players positioned outside of the arc. The plot below is an example of this setup, pulled from a Rockets game.
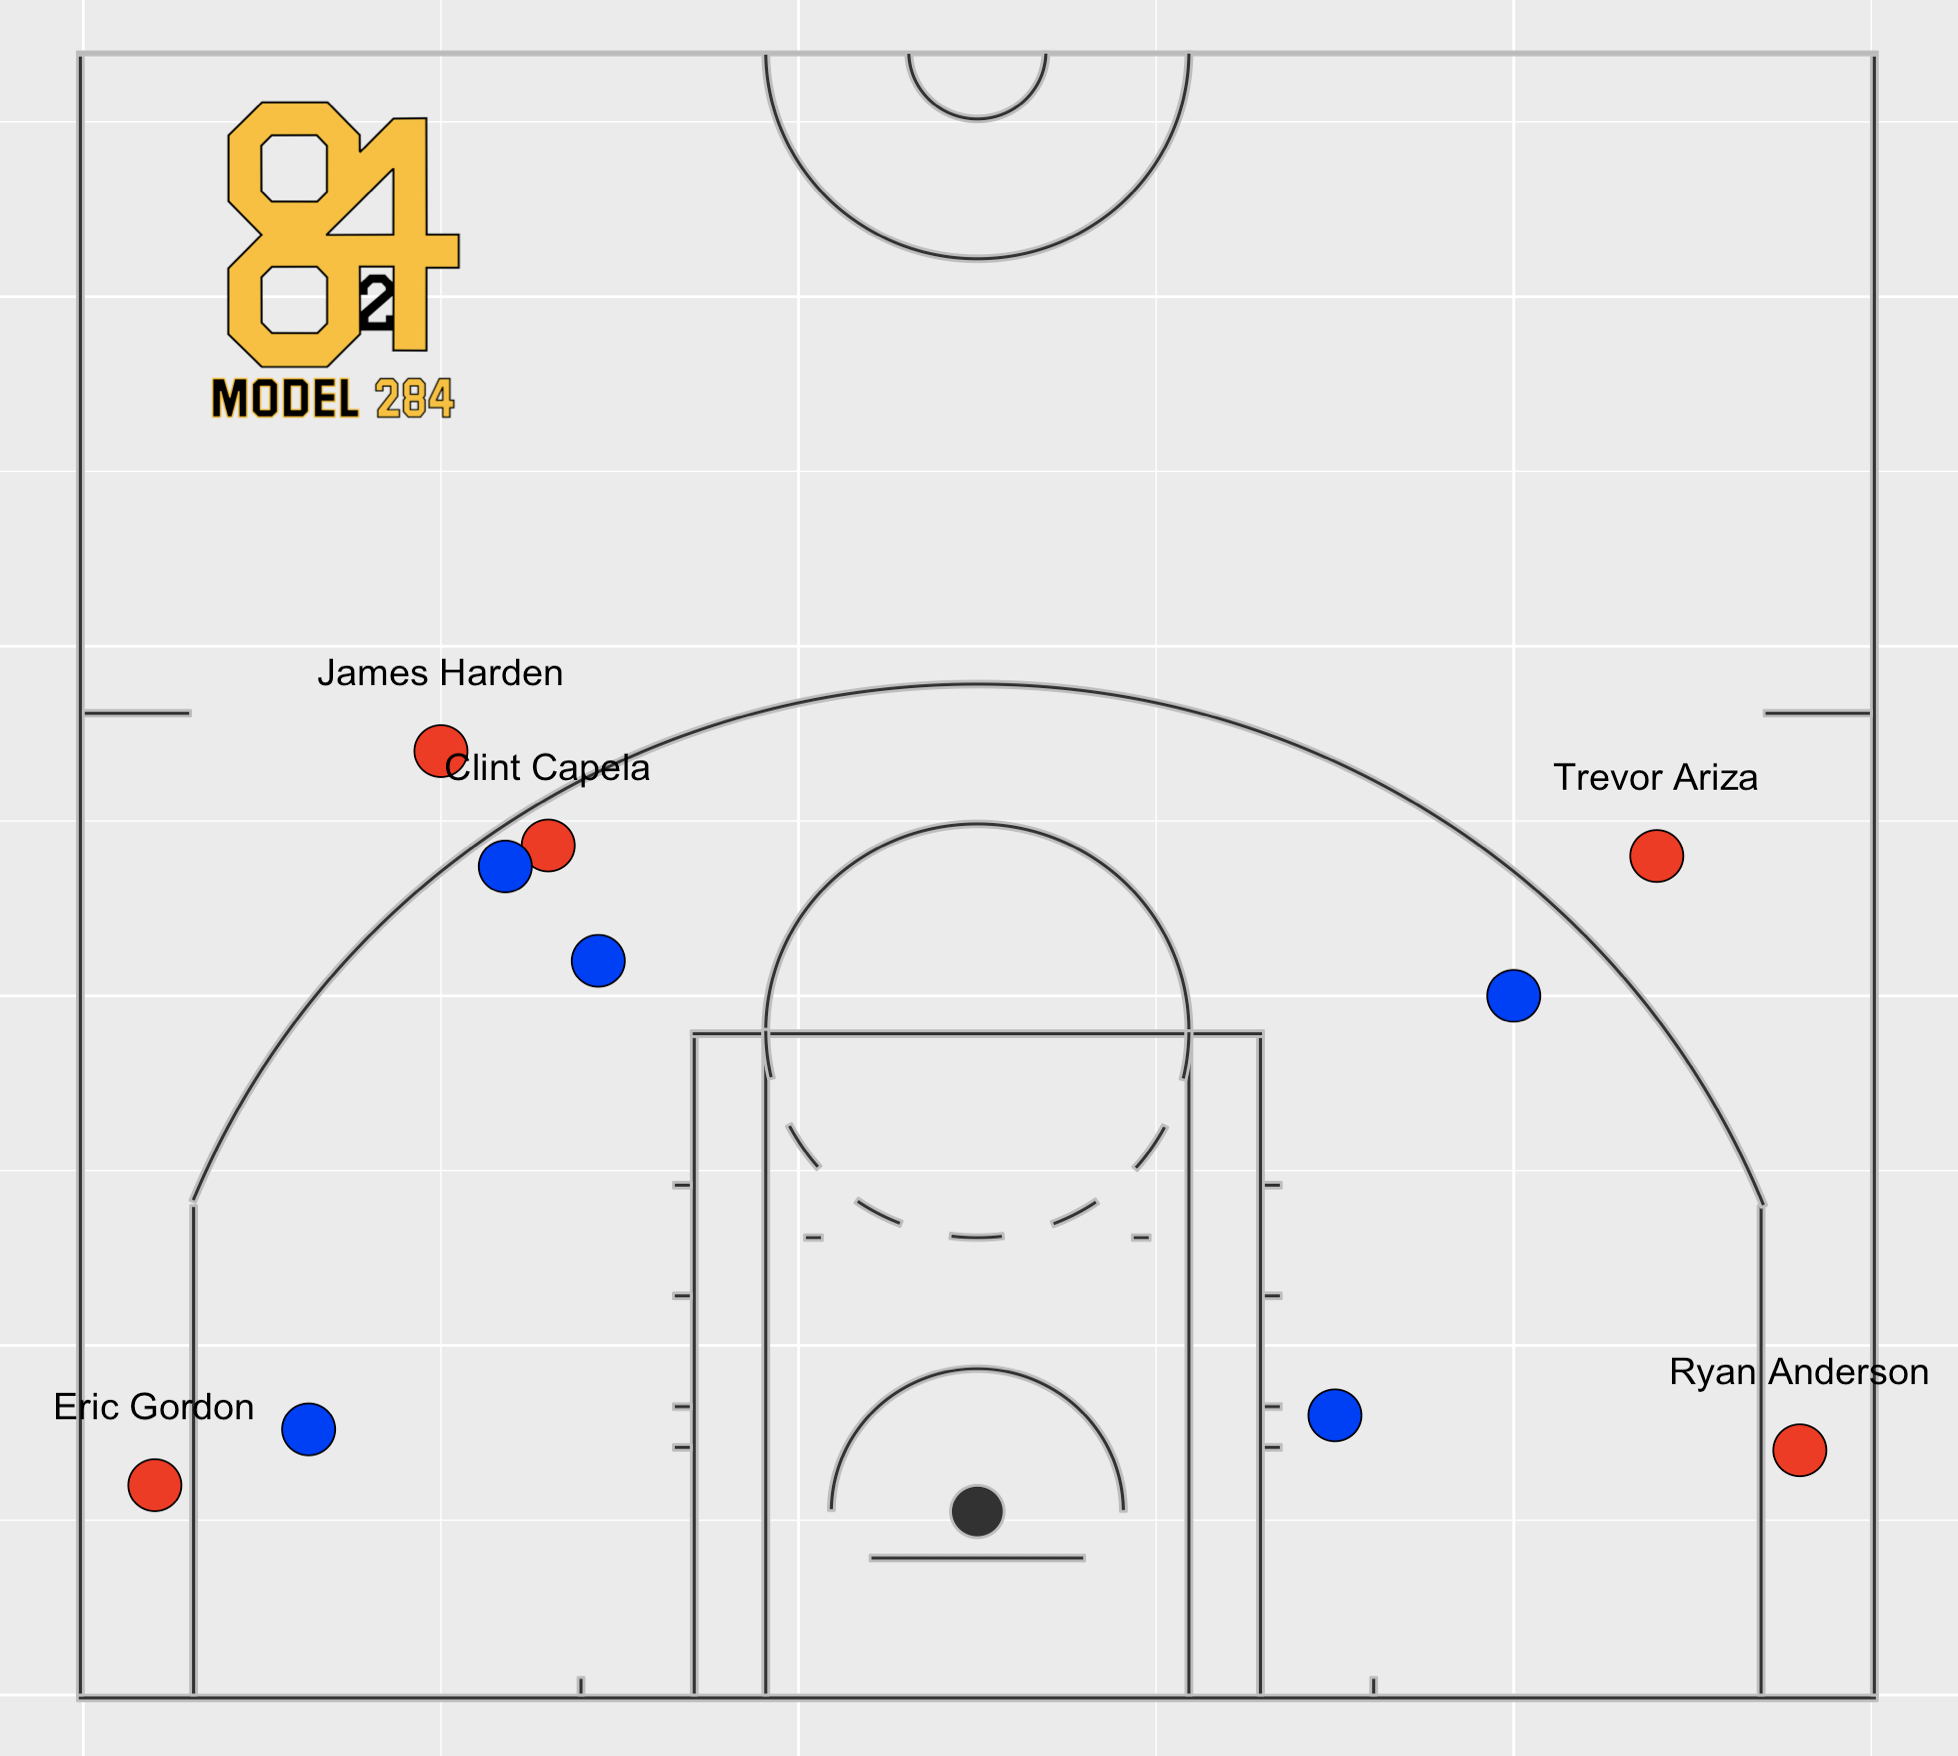
As you might imagine, Harden will either pull up or start to drive. If he drives, he will then either kick it or take it to the hoop. Steve Shea provides evidence for the usefulneess of this lineup construction, as well as a good example of a Bulls lineup that fits the above picture, in the following articles: (1) http://www.basketballanalyticsbook.com/2017/01/03/the-bulls-have-a-lineup-construction-problem-blame-the-gm-and-coach/ (2) http://www.basketballanalyticsbook.com/2016/02/21/how-not-to-construct-an-nba-lineup/
An especially popular name in basketball analytics circles is Kyle Korver, who is the prototypical of a player who improves a lineup’s “spacing.” An exceptional three-point shooter, Korver almost forces defenses to put a defender right on top of him on the three-point line because of his catch-and-shoot ability. As you likely know, this creates “space” for both the ball handler (e.g., James Harden) and the roll man (e.g., DeAndre Jordan) by removing a help defender.
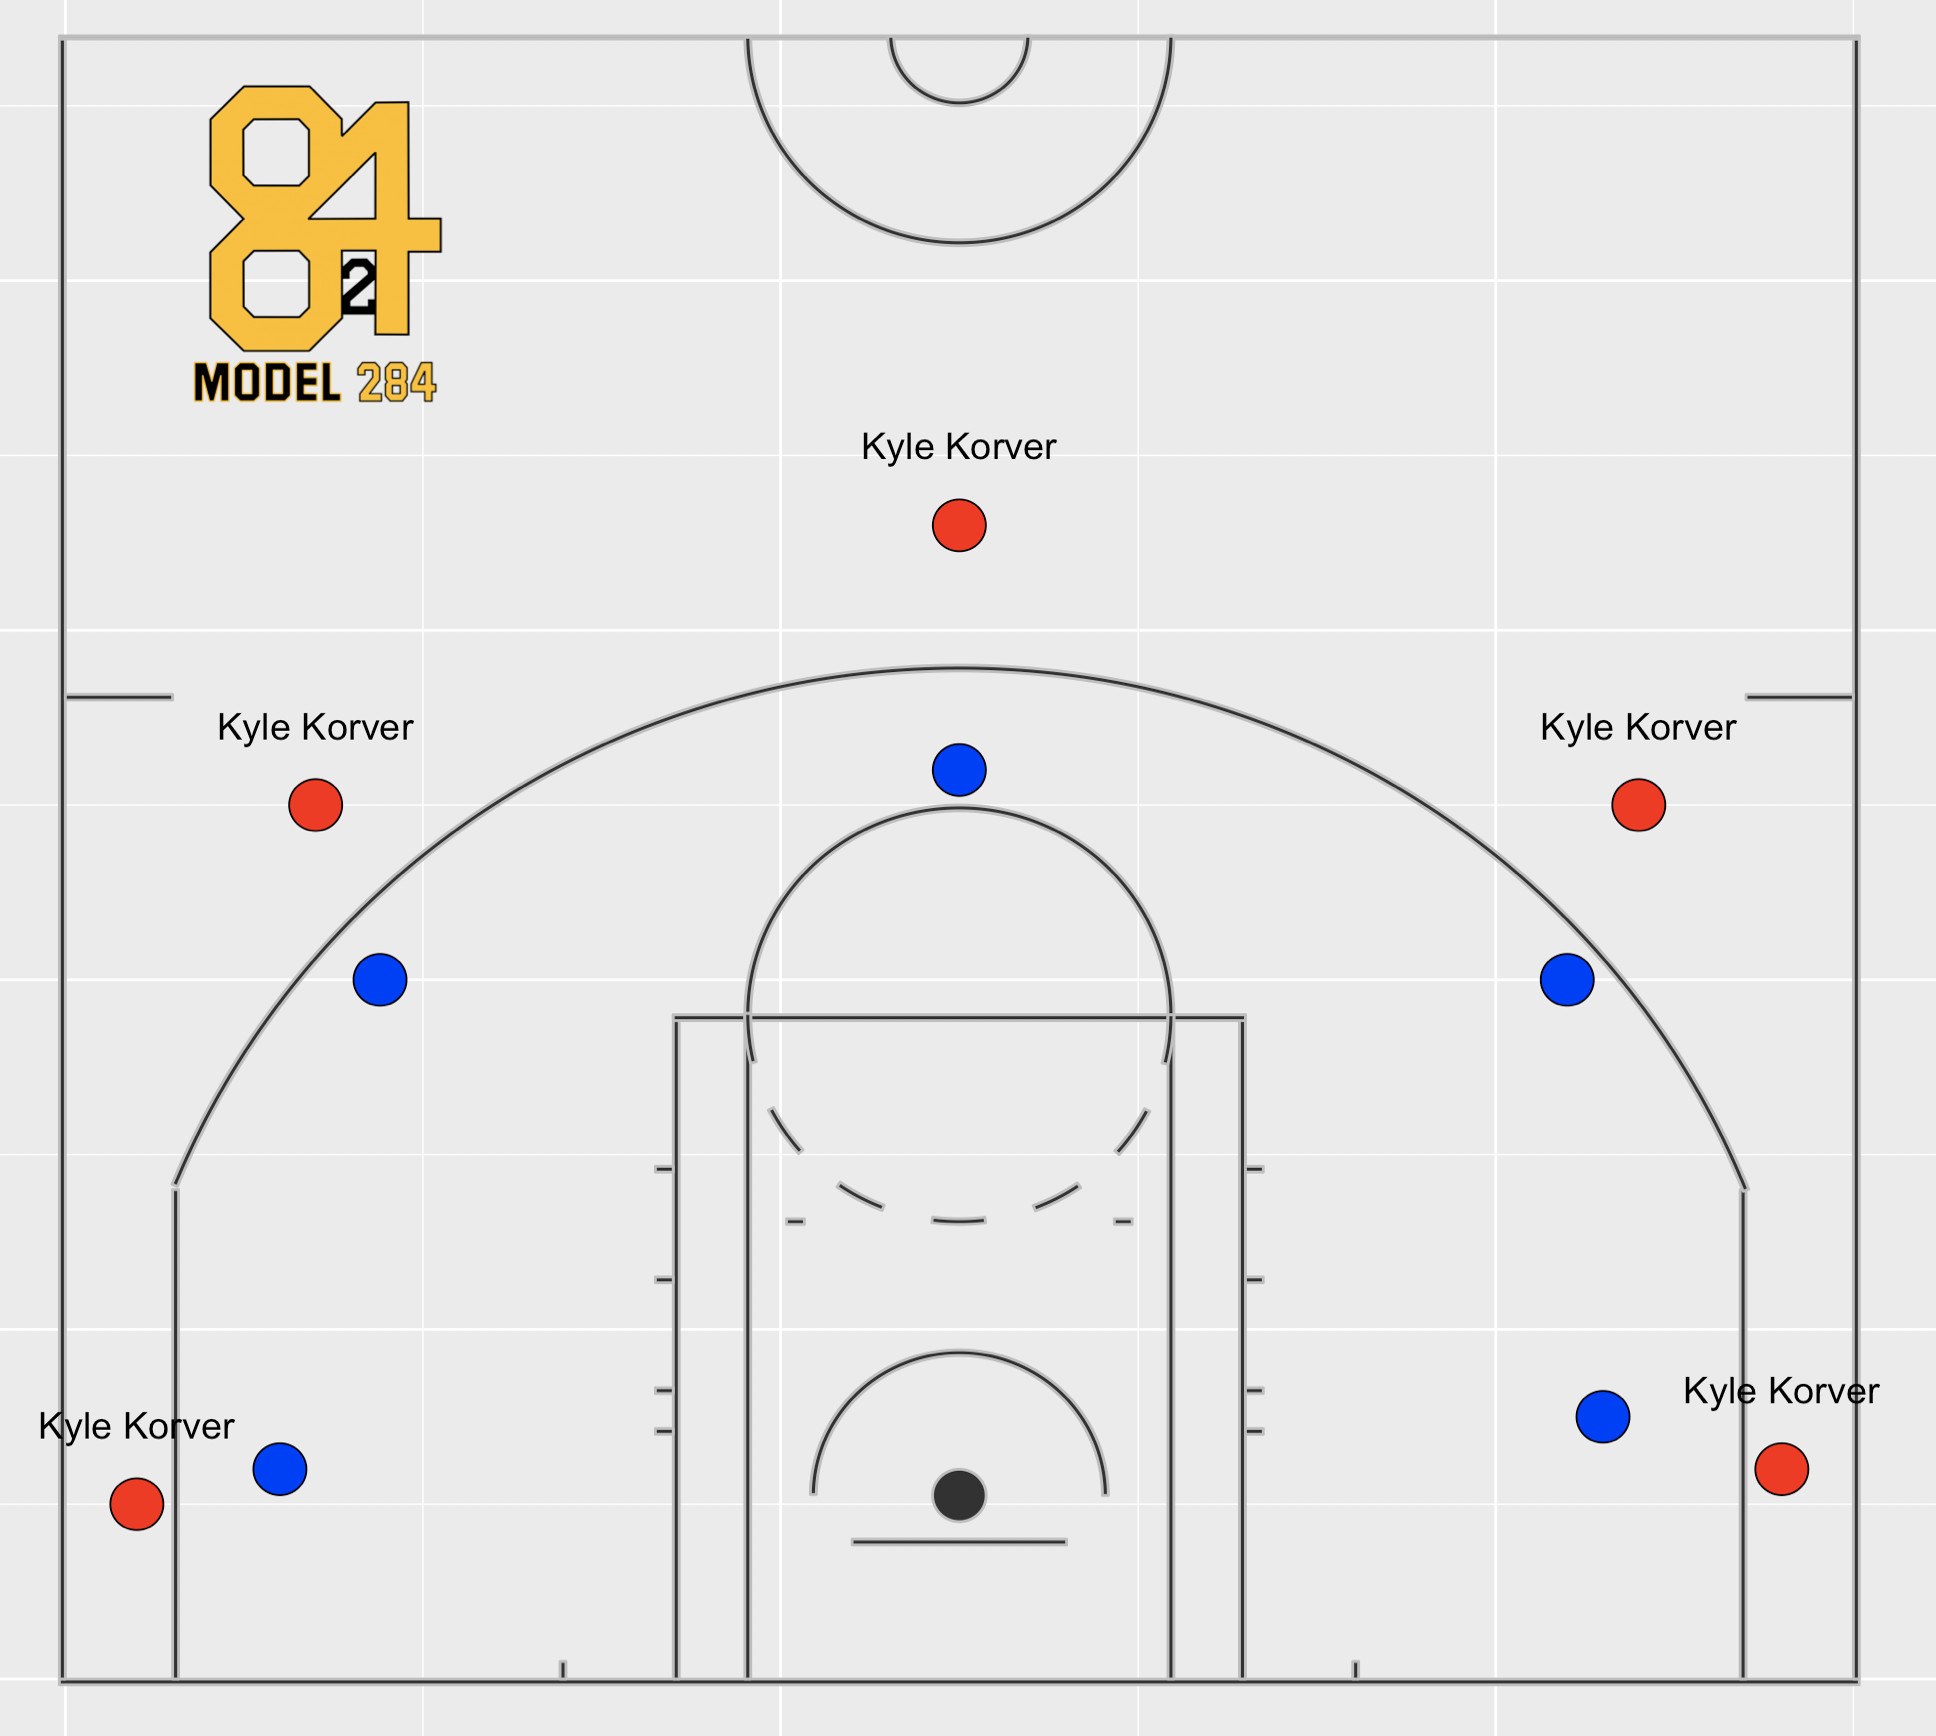
Does a lineup with James Harden, DeAndre Jordan, and three Kyle Korvers maximize the most efficient shots? Maybe, but what about five Kyle Korvers? Or five DeAndre Jordans? Or five James Hardens? And can we quantify the skills required for a perfectly spaced lineup? Well, if there were five Kyle Korvers, the defense could simply put all five defenders on top of each Kyle clone, which might look something like this:
Conversely, if there were five DeAndre Jordans, players that spend most of their time at the rim, we might see something like this:
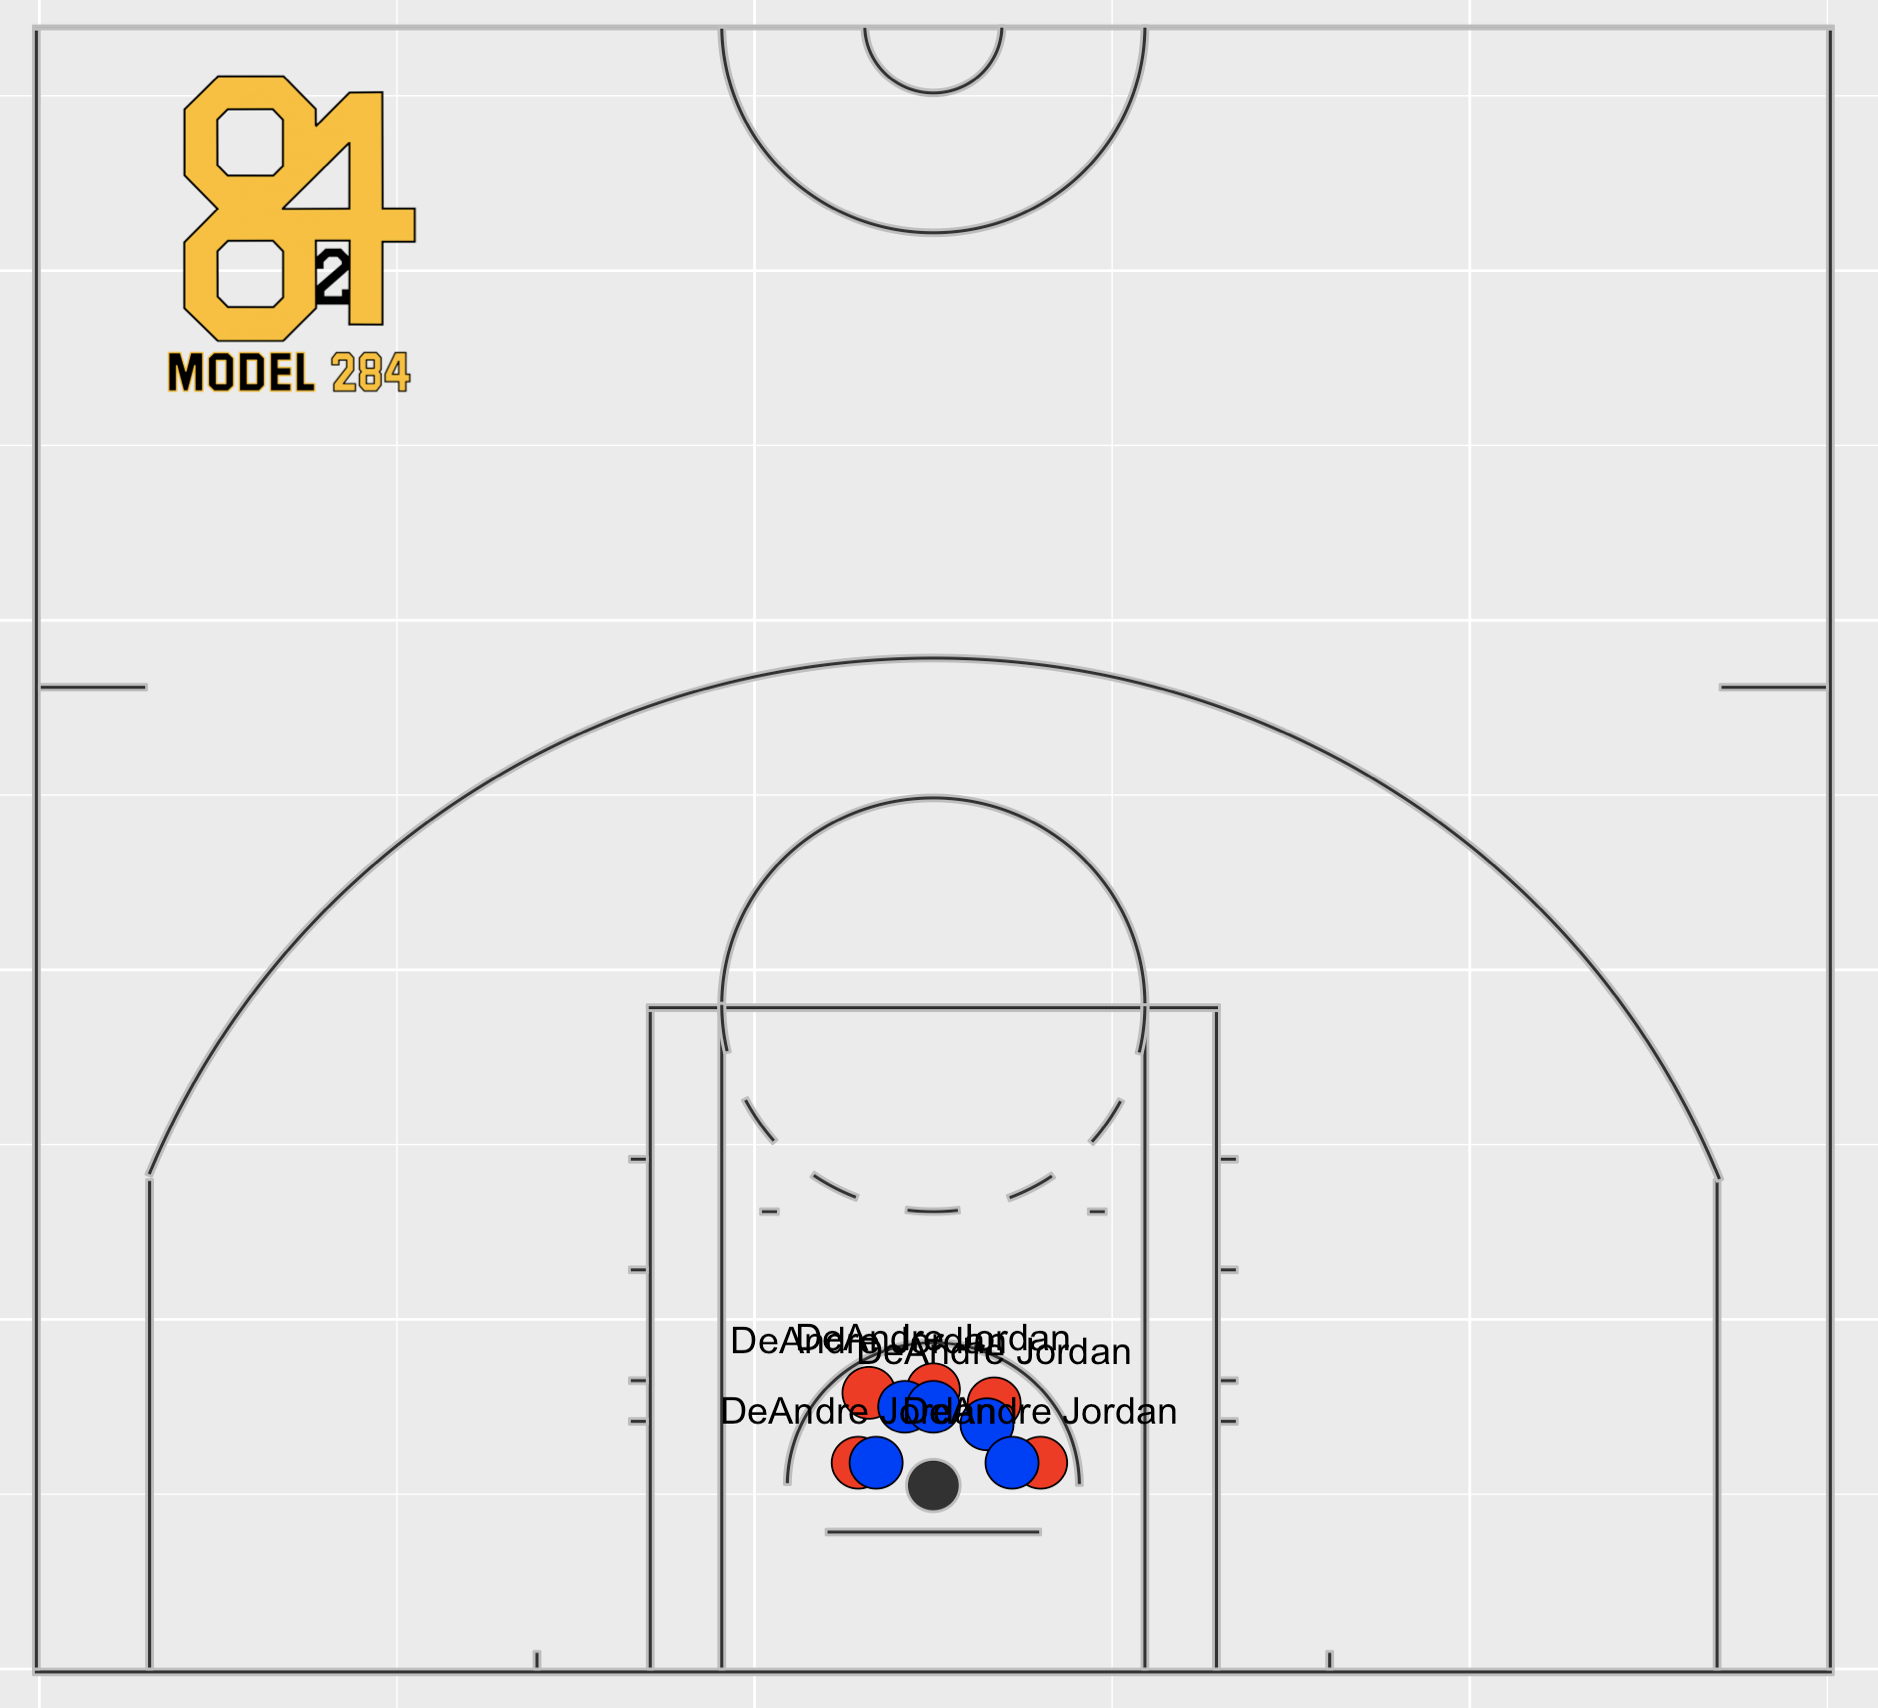
And if the DeAndre Jordans tried to space out the defense…
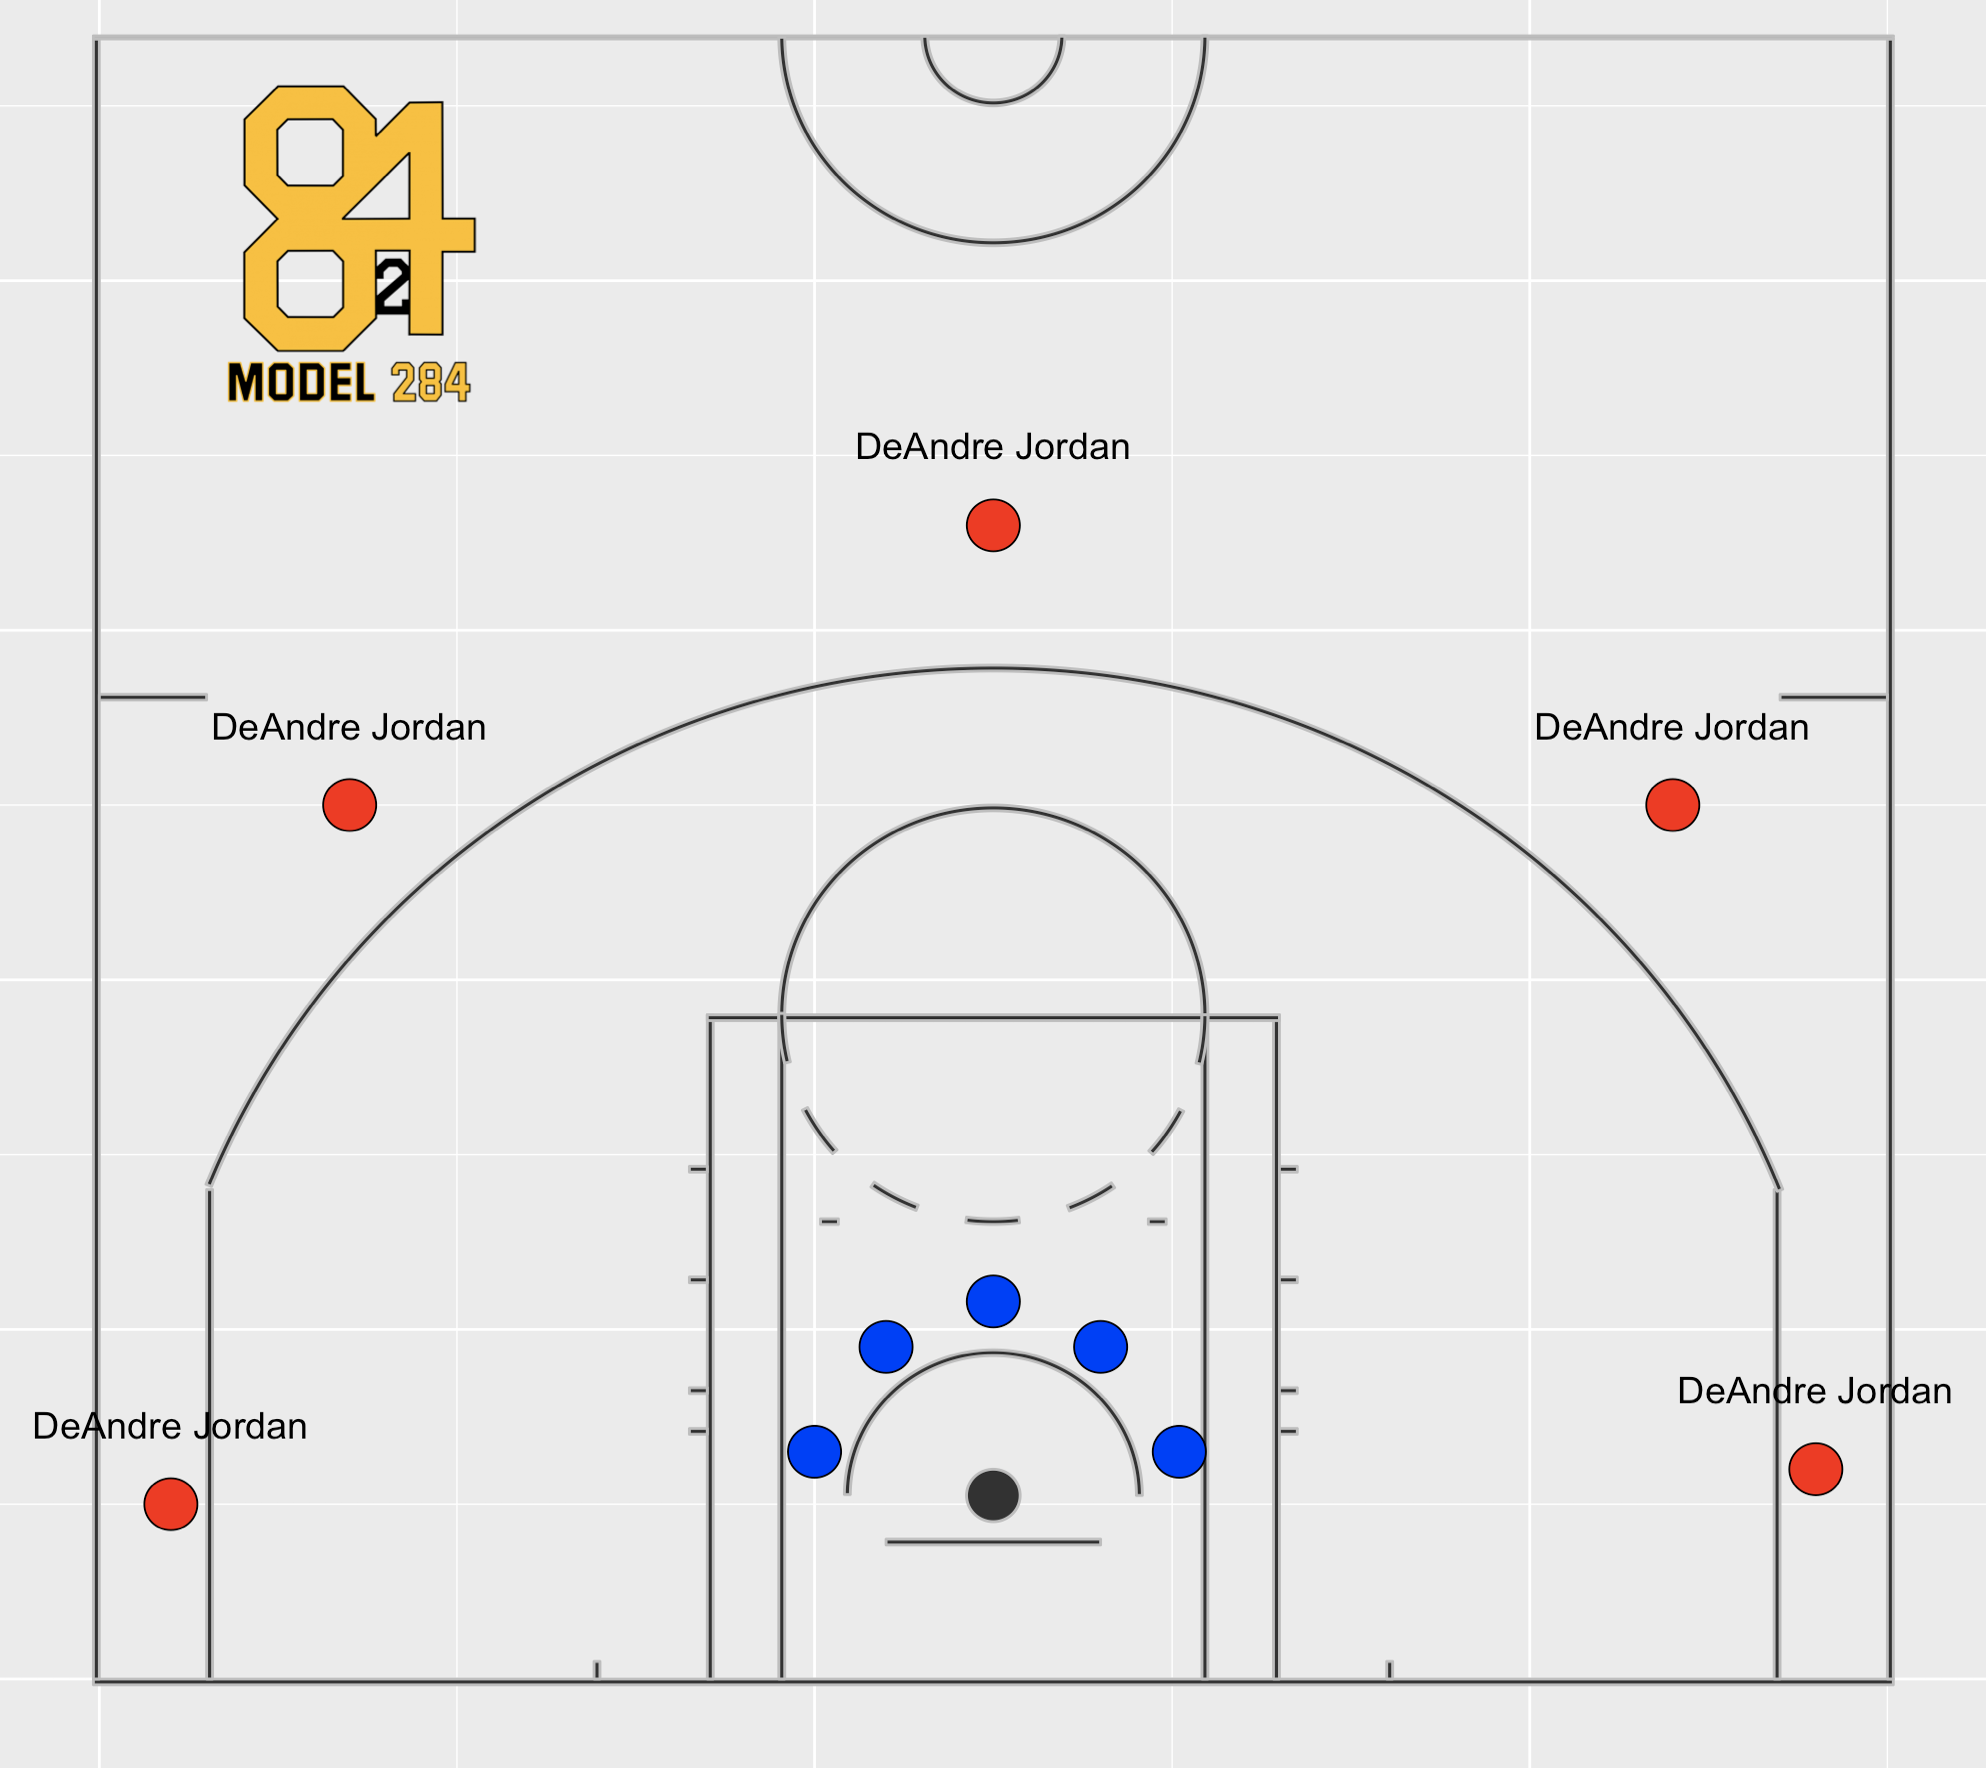
Obviously, these are extreme examples, but, in theory, we do want to reward “spacing” for lineups with both Kyle Korver and DeAndre Jordan types, while penalizing lineups for having too many of one of those extremes. But how much of each player type is ideal? Steve Shea’s article “How Not To Construct A Lineup” notes that “[their] research suggested 3 capable 3-point shooters and 1 solid interior defender / rebounder” is ideal, (e.g. Robin Lopez and Taj Gibson in the case of the Bulls).
In sum, having one elite rim finisher should suffice. The rest of the spacing ability best results from a collection of four perimeter players who can drive and shoot from three.
Nick Sciria at Nylon Calculus provides a rough draft of “spacing” in his article, Spacing Rating and why the Timberwolves may struggle. In short, Sciria creates an estimate of three-point percentage and three-point rate for lineups based on individual player three-point makes and attempts per 100 possessions and rolling them up to a lineup level. From there, he takes an average percentile of each to arrive at a spacing measure. At the end of the article, Sciria lists a few additional factors relating to spacing. We attempted to incorporate these into our own spacing calculation:
- Catch and Shoot vs Pull-up three point preference
- Ability to Drive
- “Inside-out” gravity
Methodology
In order to maximize efficient shots, a player will typically catch the ball in one of two areas: (1) at the three-point line, where he can shoot immediately, dribble and pull-up or drive (assuming he doesn’t pass), or (2) in the paint, where he will likely put up a dunk or lay-up. So, rather than looking simply at three-point shooting, we will incorporate a combination shooting and driving frequency and efficiency with the following:
- Catch and Shoot 3PAs
- Pull-up 3PAs
- Drive Attempts
As discussed previously, you want to keep your defender unsure of what you are doing. Therefore, having a diverse way to score allows you to make the defender’s job more difficult. For example, let’s go back to the concept of a defender being placed right on Kyle Korver. If the defender starts to run out to Korver, he should be able to drive past the defender, especially if he is a capable driver of the basketball. A shooter needs to not only shoot certain shots often but also effectively.
How do we account for DeAndre Jordan, who doesn’t catch the ball outside very often? To capture the finisher at the rim, we look at scoring less than 5 feet from the hoop (minus drives). The idea behind this is to capture the inside presence that draws help defenders down low, opening the perimeter shooters.
So we have four different types of shooting: Catch and Shoot, Pull-up, Drives, and Shots at the Rim. For each of these statistics, we start at the individual player level and roll up to the lineup level. For Catch and Shoots, Pull-ups, and Drives, we average the frequency with which each player attempts each shot weighted by their usage and adjusted for efficiency, resulting in a lineup-level measure for each of the aforementioned types of shots. Next, we scale these lineup level estimates for each shot type and return a standard deviation.
With shots from less than 5 feet, we take the maximum frequency-adjusted percentage among the individual players in the lineup. This should theoretically give us an indication of the effectiveness of our center. For reference, DeAndre Jordan, Rudy Gobert, Clint Capela would all be tops in this category.
Now that we have all our calculations, we scale the lineup measures and then sum the standard deviations to arrive at our spacing metric.
*Note that each statistic (i.e. Catch and Shoots 3PAs, Pull-up 3PAs, etc.) are evenly weighted. While this may not be optimal, intuitively, this weighting system, where we more heavily weight 3PAs, makes sense given that having multiple three-point shooters is highly correlated with lineup offensive rating, as suggested by Steve Shea’s research.
Results
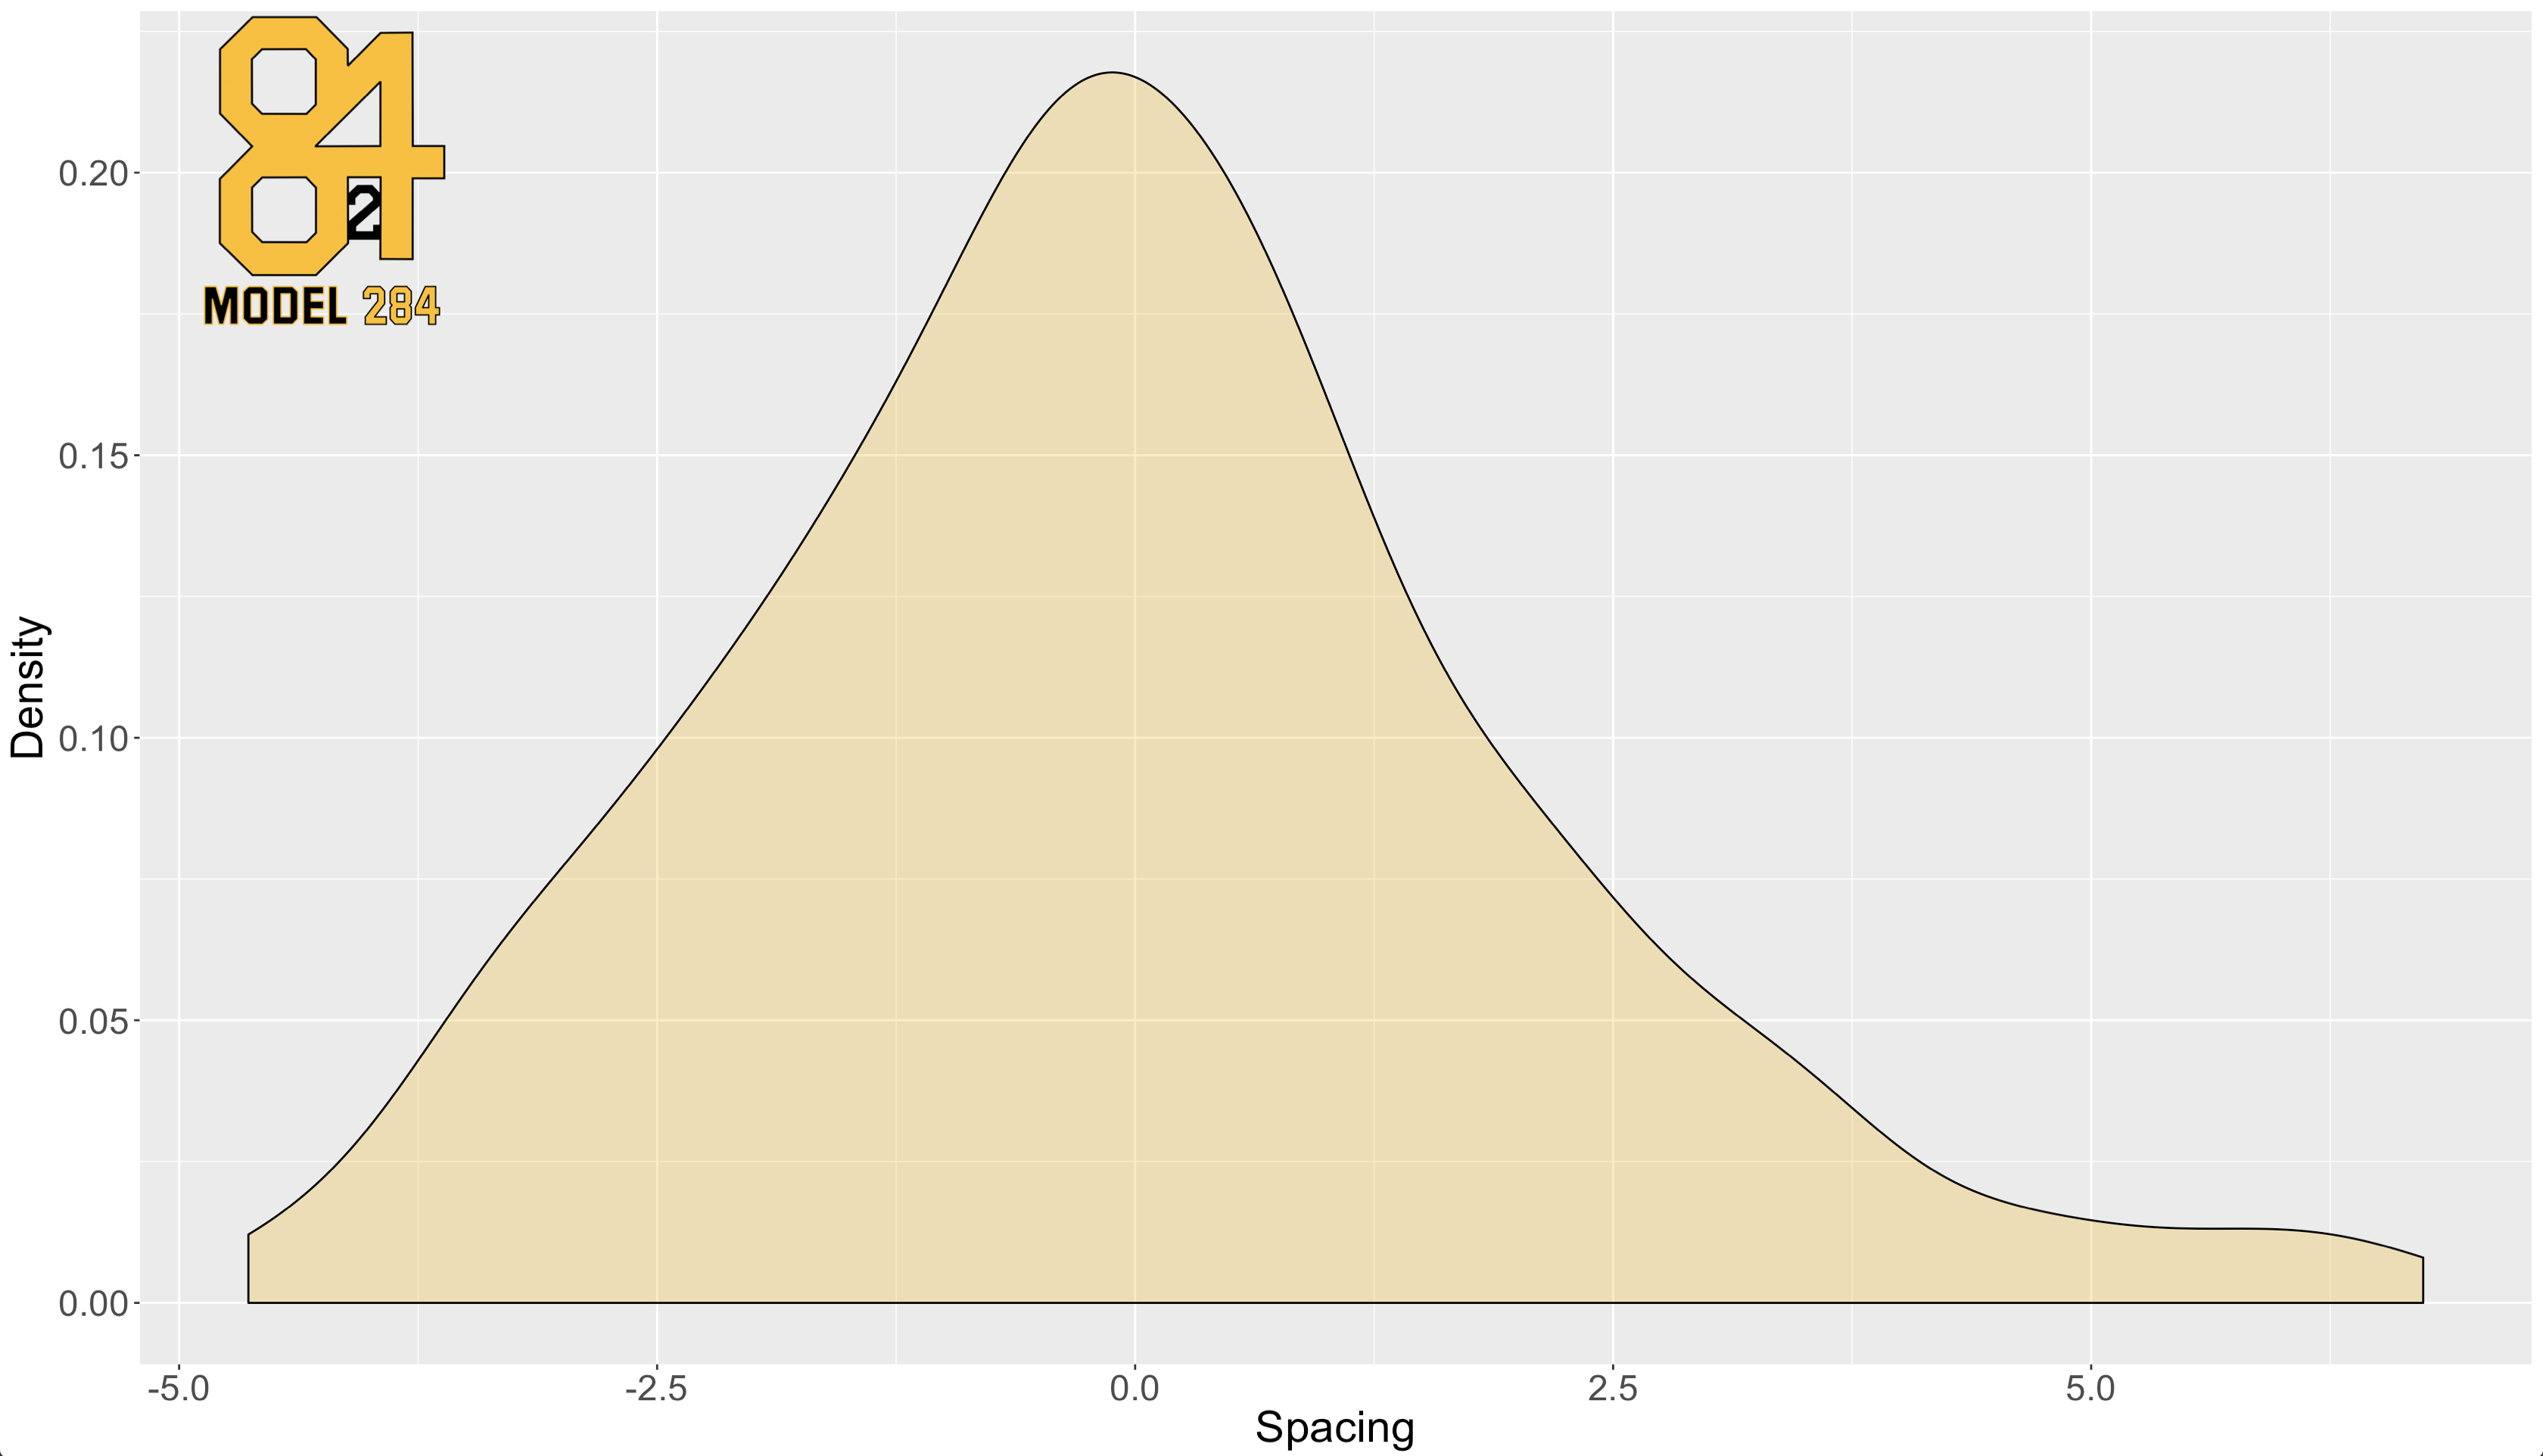
First, to give you an idea of the values of our spacing metrics, here is the distribution of spacing scores for lineups from 2016-2017 NBA season (filtered by at least 50 Minutes played).
Fun! The table below shows some of the top rated lineups for 2016-2017:
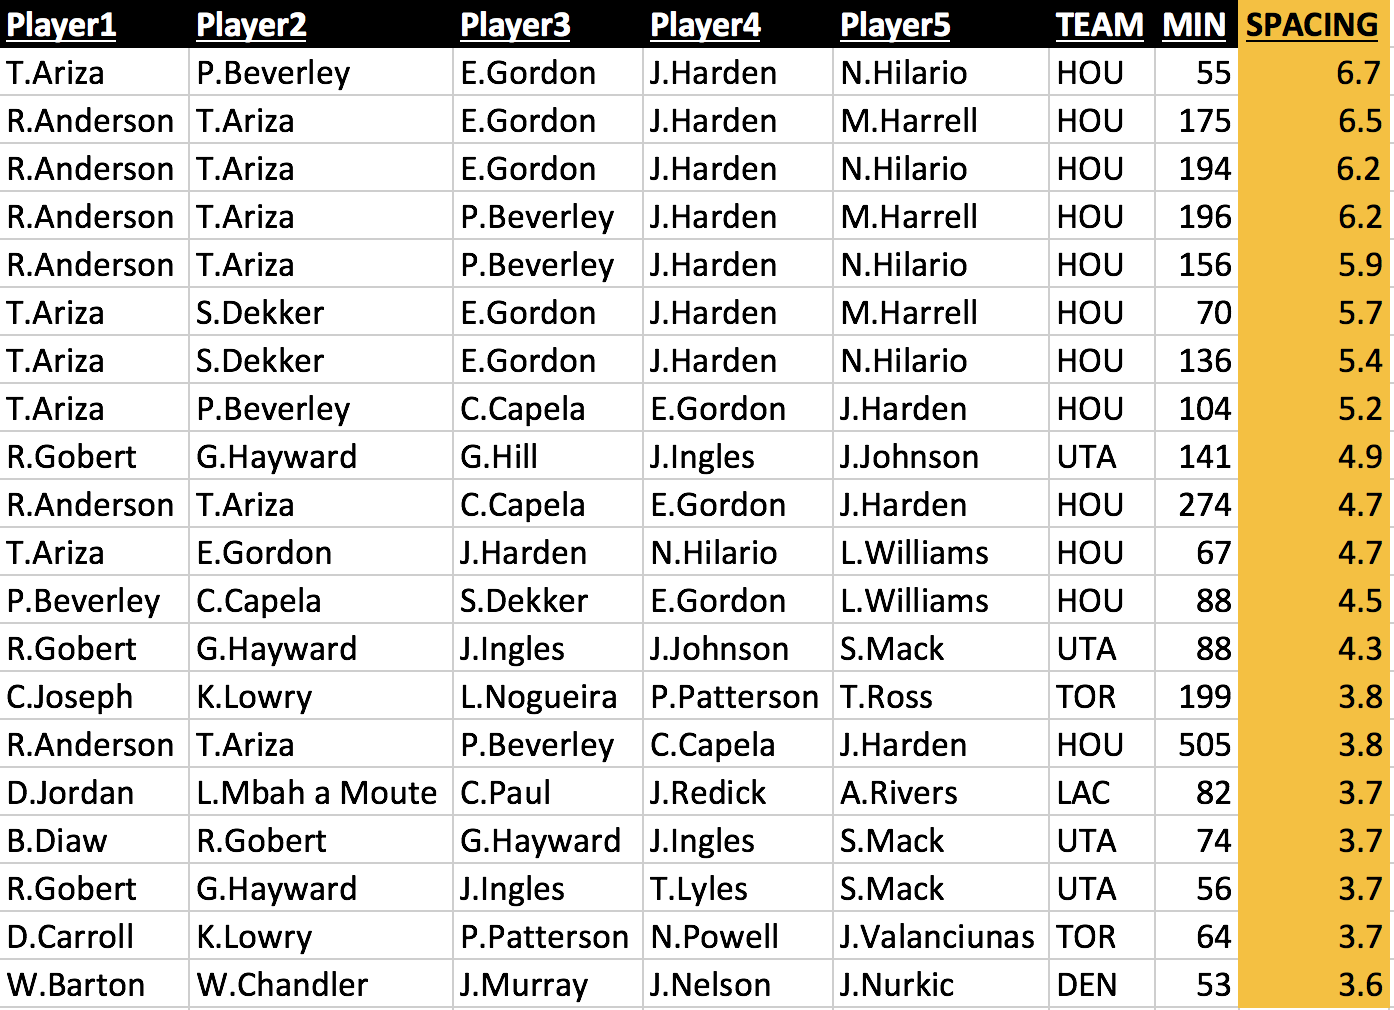
And as one might expect the top spaced lineups are primarily built from the Houston Rockets. Might as well call this the Daryl Morey statistic. Anyway, here are the worst rated Lineups from 2016-2017:
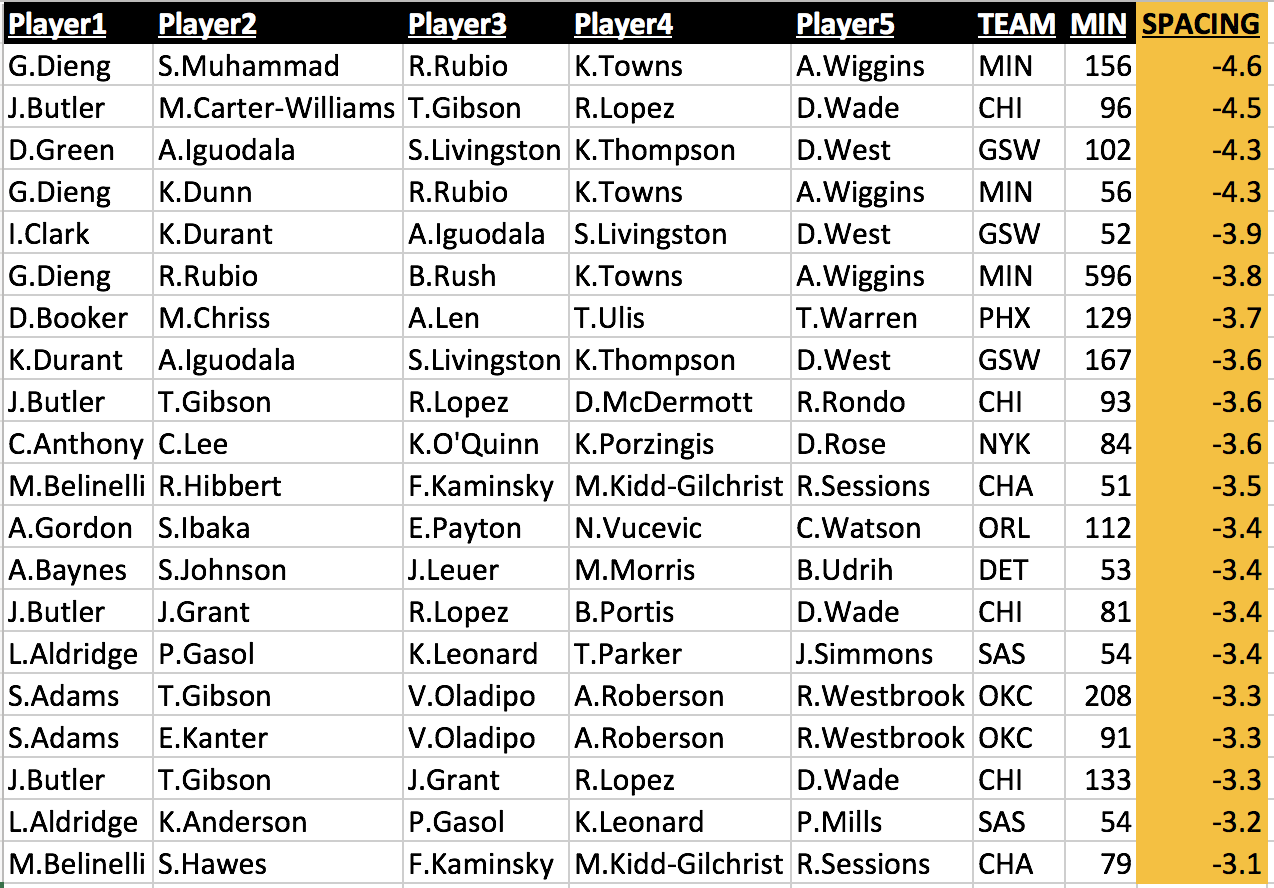
We see a little bit more diversity in the worst rated lineups, but some of the top teams known for poor spacing (according to NBA twitter) were the Chicago Bulls, Minnesota Timberwolves, and Oklahoma City Thunder. In the Wolves’ case, the combination of two traditional big men (Gorgui and KAT), Wiggins iso game, and Rubio’s poor shooting gave the Timberwolves poor spacing ratings, no matter the fifth member. The second-worst spacing lineup combination was Butler, Wade, Carter-Williams, Lopez, and Gibson: two traditional bigs and three ball-dominant, poor-shooting wings or guards (save maybe for the okay-shooting Butler).
Is this measure predictive of offensive performance?
Tough question. Below is a scatterplot of Offensive Rating and our Spacing Rating, along with the correlation between the two, which is 0.29:

The correlation between spacing and offensive rating is positive (thankfully) but weak. Taking another step, we built a simple linear regression model with our response variable, y, being offensive rating and a single independent variable, Spacing Rating as x. The resulting model showed Spacing Rating with a positive coefficient estimate of roughly 1.1 and a p-value < 0.01; although the Spacing Rating only explained 7.7% of the variable in Offensive Rating. The low adjusted R-squared is likely due to two reasons: 1) there are other factors we are not accounting for such as playmaking, overall scoring efficiency, etc. and 2) lineup offensive rating is difficult to predict. So while having a higher spacer rating does correlate with a higher offensive rating, it is far from the only thing that contributes to having a high offensive rating.
Concluding Thoughts
First, our spacing rating can be thought of as more of an optimal lineup measurement (or a Daryl Morey lineup statistic). Secondly, There appears to be some positive relationship between lineup spacing and offensive rating. Thirdly, the best or highest rated spacing lineup we have found thus far is James Harden, Stephen Curry, Klay Thompson, Paul George and DeAndre Jordan at 10.7!
Here a few data sources / articles in the realm of NBA Lineup spacing.
Sources:
Data – http://stats.nba.com/
APBR Forum – http://apbr.org/metrics/viewtopic.php?f=2&t=9367&hilit=Play+Type&start=0
Steve Shea: Bulls Lineup Construction Problem – http://www.basketballanalyticsbook.com/2017/01/03/the-bulls-have-a-lineup-construction-problem-blame-the-gm-and-coach/
Justin Jacobs: Rebounding Rates: Good for Teams; Bad for Players – https://squared2020.com/2017/07/31/rebounding-rates-good-for-teams-bad-for-players/
Nylon Calculus: Rankings the Best and Worst Offensive Scorers in Each Role https://fansided.com/2017/08/09/nylon-calculus-ranking-best-worst-scorers-every-offensive-role/
Steve Shea: Analyzing Detroits Offense – http://www.basketballanalyticsbook.com/2017/03/06/analyzing-detroits-offense-details-matter/
Justin Jacobs: Relationship between TS% and eFG% – https://squared2020.com/2017/10/10/relationship-between-ts-and-efg/
Dean Oliver: Basketball on Paper (2004) – https://www.basketball-reference.com/about/ratings.html
Steve Shea: How not to construct a lineup – http://www.basketballanalyticsbook.com/2016/02/21/how-not-to-construct-an-nba-lineup/
https://fansided.com/2017/07/05/nylon-calculus-spacing-rating-timberwolves/
Written by Marc Richards and Jack Werner.
96 thoughts on “NBA Lineup Evaluator: Spacing”
Comments are closed.