The article below shows how our models view this year’s tournament field from a simulation perspective. Each table shows the % chance that each team advances to a given round of the tournament (e.g., in the first table, Gonzaga has a 92.5% chance of advancing to the 2nd round). These figures are calculated based on 1,000 simulations of this year’s tournament, which were performed using win probability and spread predictions from our models. See our related posts for our Full 2021 Tournament Bracket and our Game-by-Game Predictions.
Tournament simulations are an awesome tool that can be used to account for all the potential matchups that teams could face on their way to cutting down the nets. They are extremely useful for comparing “what is most likely to happen” against public picks to find optimal places to differentiate your bracket from others in your pool. They also do a great job of highlighting how difficult it is to make a run in this tournament – even the teams that are most likely to get to the Final Four usually have less than a 50% chance of doing so (i.e., it is more likely that they DO NOT make the Final Four).
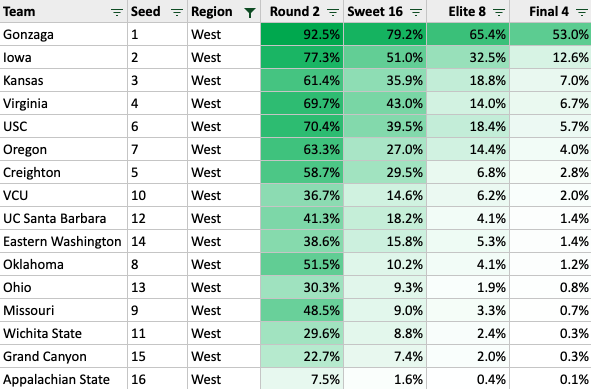
West Region
Gonzaga (53%) is the overwhelming favorite to come out of the West region by our numbers. Note that Kansas (7%) and Virginia (7%) are both dealing with COVID cases, and could potentially be short-handed (or even withdraw from the tournament). We have not adjusted their data. Iowa (13%) is most likely to come out of the bottom half of the bracket, though they project to get strong competition from Oregon (4%) and USC (6%).
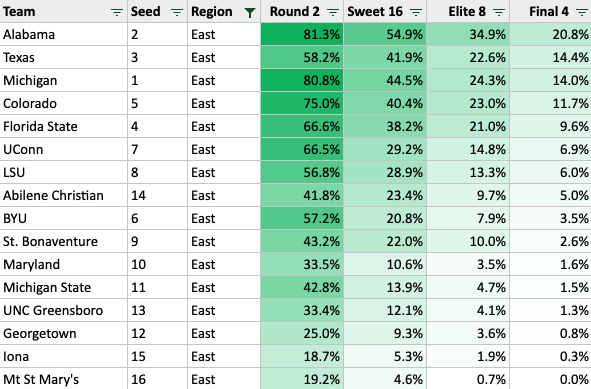
East Region
The East is much more wide open, with four teams projected with at least a 10% chance of making it to the Final Four. Alabama (21%) is the most likely representative from the East based on our models. Note that we regressed a few of Michigan’s (14%) statistics by 0-5% to account for the Isaiah Livers injury (they will be missing one of their best players).
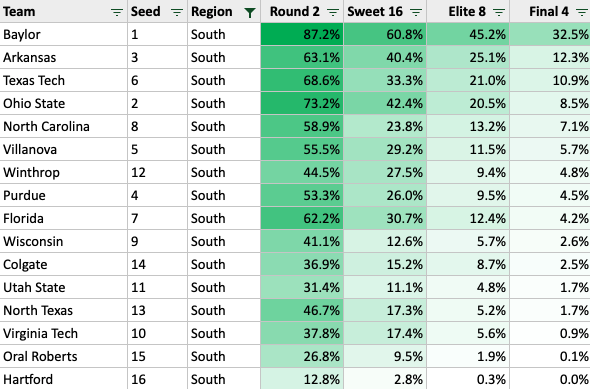
South Region
Baylor (33%) is roughly twice as likely as any other team to make the Final Four out of the South. They are helped by the fact that Villanova (6%) will not be at full strength – note that we regressed a few of Villanova’s statistics by 0-5% to account for the Collin Gillespie injury (they will be missing one of their best players). Texas Tech (11%) and Arkansas (12%) look most likely to challenge Baylor, while our models are not as high as the consensus on Ohio State (9%) in the bottom half of this region.
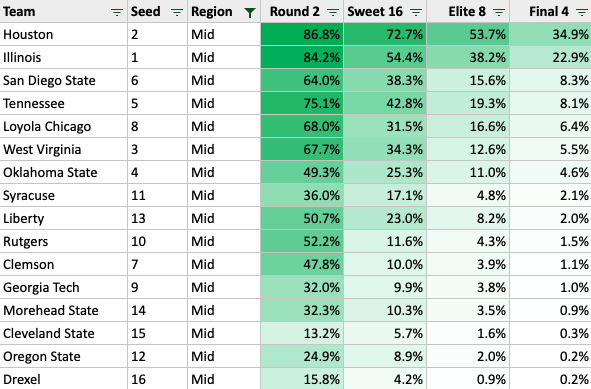
Midwest Region
Houston (35%) is perhaps a surprise here, but they rank strongly in our models. Illinois (23%) is not helped by tough 2nd and 3rd round projected matchups with Loyola Chicago and Tennesse/Oklahoma State. Sadly, our models are not very high on Cade Cunningham and the Cowboys (5%). I’ve got a bad feeling about this….
Tournament Champ
Our numbers see Gonzaga (33%) as the overwhelming favorite to win it all this year. Comparing to ESPN’s public bracket data, about 36% of the public is picking Gonzaga as their champion, which is roughly in line with our number, meaning there isn’t necessarily “value” in picking Gonzaga as champion. If you’re in a smaller pool, it’s fine to pick Gonzaga as your champion, but, if you’re in a pool with 100+ people, you will want to go outside the box. Houston (12%) is the obvious contrarian choice by our models, as only 3% of public brackets have Houston winning it all. Baylor (12%) and Illinois (5%) will be popular public choices, but Alabama (5%) or Iowa (5%) would be much more contrarian choices and present better values according to our models. Further, Iowa is also interesting because, should they win, they would give you leverage against the field by beating Gonzaga early (and many people in your pool will have Gonzaga going far). Here is the full output of our simulation:
| Team | Seed | Quad | Round Two | Sweet 16 | Elite 8 | Final Four | Champ Game | Win |
|---|---|---|---|---|---|---|---|---|
| Gonzaga | 1 | West | 0.925 | 0.792 | 0.654 | 0.53 | 0.421 | 0.332 |
| Baylor | 1 | South | 0.872 | 0.608 | 0.452 | 0.325 | 0.218 | 0.117 |
| Houston | 2 | Mid | 0.868 | 0.727 | 0.537 | 0.349 | 0.231 | 0.115 |
| Illinois | 1 | Mid | 0.842 | 0.544 | 0.382 | 0.229 | 0.117 | 0.053 |
| Iowa | 2 | West | 0.773 | 0.51 | 0.325 | 0.126 | 0.086 | 0.046 |
| Alabama | 2 | East | 0.813 | 0.549 | 0.349 | 0.208 | 0.094 | 0.045 |
| Michigan | 1 | East | 0.808 | 0.445 | 0.243 | 0.14 | 0.054 | 0.031 |
| Texas | 3 | East | 0.582 | 0.419 | 0.226 | 0.144 | 0.052 | 0.021 |
| Arkansas | 3 | South | 0.631 | 0.404 | 0.251 | 0.123 | 0.05 | 0.021 |
| Kansas | 3 | West | 0.614 | 0.359 | 0.188 | 0.07 | 0.037 | 0.018 |
| Virginia | 4 | West | 0.697 | 0.43 | 0.14 | 0.067 | 0.037 | 0.017 |
| Ohio State | 2 | South | 0.732 | 0.424 | 0.205 | 0.085 | 0.039 | 0.014 |
| Loyola Chicago | 8 | Mid | 0.68 | 0.315 | 0.166 | 0.064 | 0.033 | 0.014 |
| Colorado | 5 | East | 0.75 | 0.404 | 0.23 | 0.117 | 0.039 | 0.013 |
| Texas Tech | 6 | South | 0.686 | 0.333 | 0.21 | 0.109 | 0.055 | 0.011 |
| USC | 6 | West | 0.704 | 0.395 | 0.184 | 0.057 | 0.027 | 0.011 |
| UConn | 7 | East | 0.665 | 0.292 | 0.148 | 0.069 | 0.024 | 0.009 |
| LSU | 8 | East | 0.568 | 0.289 | 0.133 | 0.06 | 0.018 | 0.009 |
| Winthrop | 12 | South | 0.445 | 0.275 | 0.094 | 0.048 | 0.018 | 0.008 |
| Tennessee | 5 | Mid | 0.751 | 0.428 | 0.193 | 0.081 | 0.037 | 0.007 |
| Florida State | 4 | East | 0.666 | 0.382 | 0.21 | 0.096 | 0.023 | 0.007 |
| West Virginia | 3 | Mid | 0.677 | 0.343 | 0.126 | 0.055 | 0.021 | 0.007 |
| Oregon | 7 | West | 0.633 | 0.27 | 0.144 | 0.04 | 0.016 | 0.007 |
| Colgate | 14 | South | 0.369 | 0.152 | 0.087 | 0.025 | 0.013 | 0.007 |
| Creighton | 5 | West | 0.587 | 0.295 | 0.068 | 0.028 | 0.011 | 0.007 |
| North Carolina | 8 | South | 0.589 | 0.238 | 0.132 | 0.071 | 0.033 | 0.006 |
| San Diego State | 6 | Mid | 0.64 | 0.383 | 0.156 | 0.083 | 0.03 | 0.006 |
| Oklahoma State | 4 | Mid | 0.493 | 0.253 | 0.11 | 0.046 | 0.013 | 0.006 |
| Villanova | 5 | South | 0.555 | 0.292 | 0.115 | 0.057 | 0.021 | 0.005 |
| UC Santa Barbara | 12 | West | 0.413 | 0.182 | 0.041 | 0.014 | 0.006 | 0.004 |
| Purdue | 4 | South | 0.533 | 0.26 | 0.095 | 0.045 | 0.019 | 0.003 |
| BYU | 6 | East | 0.572 | 0.208 | 0.079 | 0.035 | 0.008 | 0.003 |
| Abilene Christian | 14 | East | 0.418 | 0.234 | 0.097 | 0.05 | 0.013 | 0.002 |
| Wisconsin | 9 | South | 0.411 | 0.126 | 0.057 | 0.026 | 0.009 | 0.002 |
| St. Bonaventure | 9 | East | 0.432 | 0.22 | 0.1 | 0.026 | 0.007 | 0.002 |
| Syracuse | 11 | Mid | 0.36 | 0.171 | 0.048 | 0.021 | 0.004 | 0.002 |
| Clemson | 7 | Mid | 0.478 | 0.1 | 0.039 | 0.011 | 0.004 | 0.002 |
| Liberty | 13 | Mid | 0.507 | 0.23 | 0.082 | 0.02 | 0.01 | 0.001 |
| Utah State | 11 | South | 0.314 | 0.111 | 0.048 | 0.017 | 0.007 | 0.001 |
| VCU | 10 | West | 0.367 | 0.146 | 0.062 | 0.02 | 0.005 | 0.001 |
| Eastern Washington | 14 | West | 0.386 | 0.158 | 0.053 | 0.014 | 0.005 | 0.001 |
| North Texas | 13 | South | 0.467 | 0.173 | 0.052 | 0.017 | 0.003 | 0.001 |
| Michigan State | 11 | East | 0.428 | 0.139 | 0.047 | 0.015 | 0.003 | 0.001 |
| Oklahoma | 8 | West | 0.515 | 0.102 | 0.041 | 0.012 | 0.003 | 0.001 |
| Maryland | 10 | East | 0.335 | 0.106 | 0.035 | 0.016 | 0.002 | 0.001 |
| Missouri | 9 | West | 0.485 | 0.09 | 0.033 | 0.007 | 0.002 | 0.001 |
| Wichita State | 11 | West | 0.296 | 0.088 | 0.024 | 0.003 | 0.001 | 0.001 |
| Florida | 7 | South | 0.622 | 0.307 | 0.124 | 0.042 | 0.011 | 0 |
| UNC Greensboro | 13 | East | 0.334 | 0.121 | 0.041 | 0.013 | 0.003 | 0 |
| Rutgers | 10 | Mid | 0.522 | 0.116 | 0.043 | 0.015 | 0.002 | 0 |
| Georgetown | 12 | East | 0.25 | 0.093 | 0.036 | 0.008 | 0.002 | 0 |
| Virginia Tech | 10 | South | 0.378 | 0.174 | 0.056 | 0.009 | 0.001 | 0 |
| Morehead State | 14 | Mid | 0.323 | 0.103 | 0.035 | 0.009 | 0.001 | 0 |
| Ohio | 13 | West | 0.303 | 0.093 | 0.019 | 0.008 | 0.001 | 0 |
| Georgia Tech | 9 | Mid | 0.32 | 0.099 | 0.038 | 0.01 | 0 | 0 |
| Grand Canyon | 15 | West | 0.227 | 0.074 | 0.02 | 0.003 | 0 | 0 |
| Iona | 15 | East | 0.187 | 0.053 | 0.019 | 0.003 | 0 | 0 |
| Cleveland State | 15 | Mid | 0.132 | 0.057 | 0.016 | 0.003 | 0 | 0 |
| Oregon State | 12 | Mid | 0.249 | 0.089 | 0.02 | 0.002 | 0 | 0 |
| Drexel | 16 | Mid | 0.158 | 0.042 | 0.009 | 0.002 | 0 | 0 |
| Oral Roberts | 15 | South | 0.268 | 0.095 | 0.019 | 0.001 | 0 | 0 |
| Appalachian State | 16 | West | 0.075 | 0.016 | 0.004 | 0.001 | 0 | 0 |
| Mt St Mary's | 16 | East | 0.192 | 0.046 | 0.007 | 0 | 0 | 0 |
| Hartford | 16 | South | 0.128 | 0.028 | 0.003 | 0 | 0 | 0 |
98 thoughts on “Tournament Simulation | March Madness 2021”
Comments are closed.