The NHL Playoff Model uses team-level and individual player statistics to predict the probability that a given team will win a series (rather than predicting each game individually). Theoretically, one would think predicting a winner of a series would be easier than predicting the probability a team wins a single game, but many things can happen throughout the course of a series, most significantly, injuries that make predicting the series winner difficult.
Predictors
First and foremost, due to data limitations on certain variables, the data only spans from 2000-2016. The Models are built on a wide range of variables, everything from goal differential to simple rating metrics, but some of the more interesting statistics were developed from questions that pertain to what makes up a championship caliber team. For example, how deep is a team’s D-core? And more importantly, is having a deep D-core essential to winning a cup? We can look at a number of different ways to numerically capture the makeup of a team’s D-Core, such as, the average points per game for the top 4 or 6 point producing defensemen, the minutes distribution of top 4 or 6 defensemen, playoff experience for top defensemen, points produced by top defensemen, and so on. Another common question is, how much top-end talent does a team have? The most simple and best predictor is the number of point per game players on a team. Unsurprisingly, having a lot of top-end talent is helpful in winning a cup (i.e. Chicago Blackhawks). Now, what about playoff experience? Is playoff experience or veteran leadership necessary? Should a team add a veteran at the trade deadline? I looked at this through the average age of the team, combined total playoff games, number of playoff appearance in recent years, etc. Ultimately, playoff experience is not as important as some other team characteristics when it comes to winning series. Now, obviously there are multiple ways to skin a cat and therefore multiple ways to build a championship caliber hockey team – likely many we have yet to see – but we can at least analyze historical data to see what has been successful so far.
Modeling Techniques
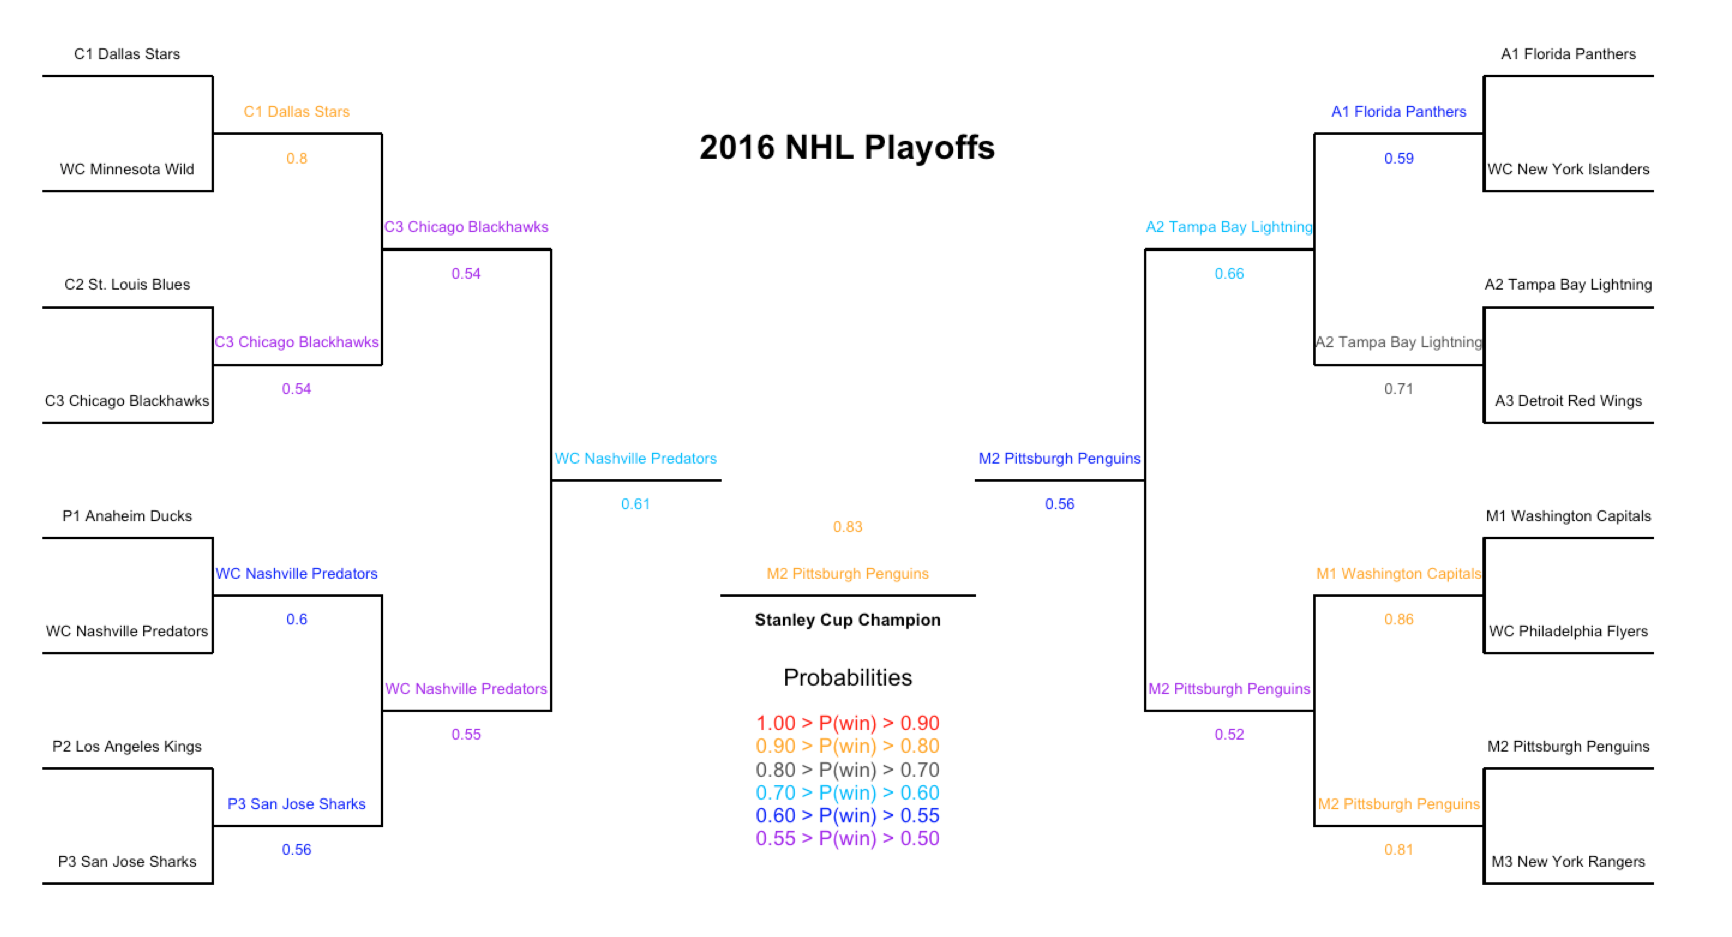
Using everyone’s favorite statistical programming language, R, I used an ensemble of machine learning and regression techniques to generate the probability that a given team would win a series. The model takes the average probability generated from Logistic regression, Linear discriminant analysis, K-nearest neighborhood, Penalized regression, Random Forests, and Boosting models. Each model may use a different combinations of variables. The variables selected for each model were based on which variables predicted the most games correctly through cross validation. Cross validation is synonymous to out-of-sample prediction. Simply speaking, you pull one series out of the dataset at a time and train the model on the remaining series, then you use the trained model to predict on the removed series or test data. Using this technique, we can simulate playoff series by removing a year of data and building the model on the remaining years. By inputting the first round or quarterfinal matchups, we can predict a playoff series by picking the team that has the higher win probability to advance, and then generate new playoff matchups for the following round(s). The problem with this method is that wrong playoff matchups will be generated along the way, which does not allow us to properly check if the model correctly predicted a series (as that series may never have actually happened). Below is an example of a simulated logistic regression model prediction on the 2016 NHL playoffs.
Below is a table of the accuracy of out-of-sample predicted results from 2000-2016. Note that this table is built from simulated NHL playoff series and a correct prediction is counted if a team correctly is predicted to advance to the next round, regardless of matchup. If we predict on each historical playoff matchup (i.e., matchups that actually happened) the model predicts roughly 70% of those matchups correctly.
| Year | %Correct | 2nd Round | Conf Finals | Finals | Champion |
|---|---|---|---|---|---|
| 2000 | 46.7% | 5 | 2 | 1 | 0 |
| 2001 | 46.7% | 4 | 2 | 1 | 0 |
| 2002 | 60.0% | 7 | 2 | 0 | 0 |
| 2003 | 53.3% | 6 | 2 | 0 | 0 |
| 2004 | 26.7% | 4 | 0 | 0 | 0 |
| 2006 | 46.7% | 6 | 1 | 0 | 0 |
| 2007 | 60.0% | 5 | 3 | 1 | 0 |
| 2008 | 80.0% | 7 | 2 | 2 | 1 |
| 2009 | 53.3% | 6 | 2 | 0 | 0 |
| 2010 | 40.0% | 4 | 2 | 0 | 0 |
| 2011 | 53.3% | 5 | 2 | 1 | 0 |
| 2012 | 40.0% | 5 | 1 | 0 | 0 |
| 2013 | 80.0% | 8 | 2 | 1 | 1 |
| 2014 | 26.7% | 4 | 0 | 0 | 0 |
| 2015 | 100% | 8 | 4 | 2 | 1 |
| 2016 | 66.7% | 6 | 2 | 1 | 1 |
| AVG | 55.5% | 5.6 | 1.8 | 0.6 | 0.25 |