Why Pitcher Similarity Scores?
Similarity scores, at their best, are a fun and useful way to understand patterns in athletes. We’ve dabbled in similarity scores here at Model 284 before, and now we’re applying it to Major League Baseball pitchers. Our motivation for this project is twofold.
The first goal is enhancing our understanding of pitchers. You’ve almost certainly heard people around the game make comparisons between pitchers. Maybe they’ve said two hurlers are similar because they’re fireballers, or sinkerballers, or crafty lefties. Our question is this: can we take these qualitative judgements and back them up with data and numbers? Our second goal relates to hitters. Ideally, similarity would allow us to identify certain pitcher types that certain hitters excel or struggle against. In this context, similarity scores could be useful for in-game lineup building or pinch-hitting decisions.
For this project, generally, we’re trying to create a metric quantifying the similarity of any pair of pitchers. More specifically, our focus is on comparing the the pitch arsenals of any pair of pitchers; we’re interested in how similar the speeds and breaks of their pitches are, as well as the frequencies with which they throw each pitch. With a goal so open-ended, there are countless ways to approach it. To judge the success of the way we choose, here’s a list of properties we’d want out of any effective pitcher similarity metric.
Desired Properties
- Similar mixing, better score: Two pitchers who mix their pitch types in the same proportion should be scored as more similar, all other things equal. For example, if two pitchers throw identical curveballs, sliders, and fastballs, they’ll score as more similar if they mix their pitches in the same proportions than if one throws lots more sliders than the other.
- Similar pitches, better score: Two pitchers whose pitches break the same way and have the same velocity should be scored as more similar, all other things equal. For example, two pitchers who throw the same proportion of fastballs, curveballs, and sliders should be scored more similarly if their fastballs are both 95 and straight than if one is a fireballer with lots of movement on his fastball and the other throws 85 and flat.
- Account for similarity in different pitch types: Even if two pitchers don’t throw the same pitches in name, their pitches can still be similar. For example, one pitcher’s hard slider with a small break could look a lot like another pitcher’s cut fastball with movement. Our score should account for that.
After we walk through the calculation of our score, we’ll evaluate its effectiveness against these three criteria.
Methodology
Comparing Pitches
A crucial component of our ability to evaluate the similarity between two pitchers is the ability to evaluate the similarity between two pitches. After all, for pitchers to be similar, their pitches need to behave similarly. Therefore, we want a way to quantify how similar, say, Francisco Liriano’s’ slider is to Martin Perez’s slider (very), or how similar Noah Syndergaard’s fastball is to Clayton Kershaw’s curveball (not at all). These pitch scores will serve as the building blocks for our pitcher metric.
First, for a given pitch type and a given pitcher, we find the “average” pitch by calculating the average speed, horizontal break, and vertical break of all pitches the pitcher threw of that type. Once we have all these “average” pitches, we scale each variable. The similarity between two pitches, then, is the sum of their squared differences in speed, vertical break, and horizontal break.
The most similar pitches were Matt Garza and Alex Cobb’s two-seam fastballs, with a score of 0.006. The most different pitches were Luis Severino’s four-seamer and Mike Fiers’ curveball, with a difference of 5.97.
Comparing Pitchers
Now we move from pitches to pitchers, where the real fun begins. Our scoring method builds off of a visually intuitive way of comparing pitchers. Here’s an example: to compare the pitch arsenals of Clayton Kershaw and Madison Bumgarner, you might look at a stacked bar plot like this.
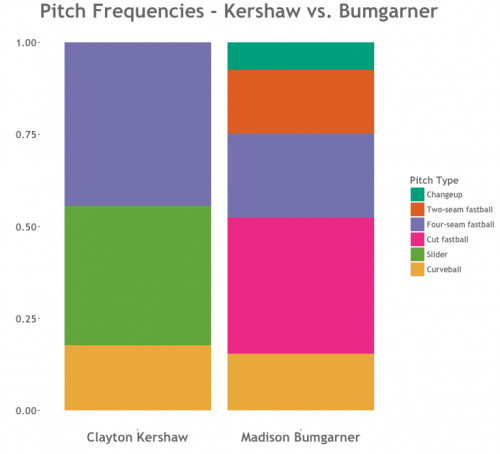
In similar pitchers, a plot like this should “line up”; their bars would be cut up in similar chunks, with each pitch lining up against a similar pitch. Our similarity score calculation formalizes this idea. For any pair of pitchers, their similarity score is the average of all their pitch similarity scores for all pitch pairs that overlap on the plot, weighted by how much they overlap.
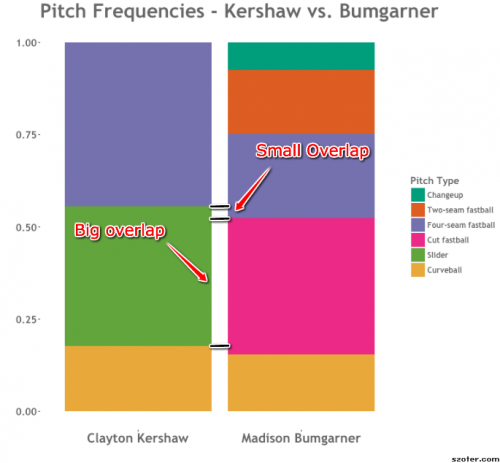
In the Kershaw-Bumgarner example, the similarity between Kershaw’s slider and Bumgarner’s cutter is included in the average, weighted heavily, since they overlap so much. The similarity between Kershaw’s slider and Bumgarner’s four-seamer is included in the average, but with a small weight corresponding to their small overlap. The similarity between Kershaw’s curveball and Bumgarner’s changeup is not included at all, because they don’t overlap in the plot.
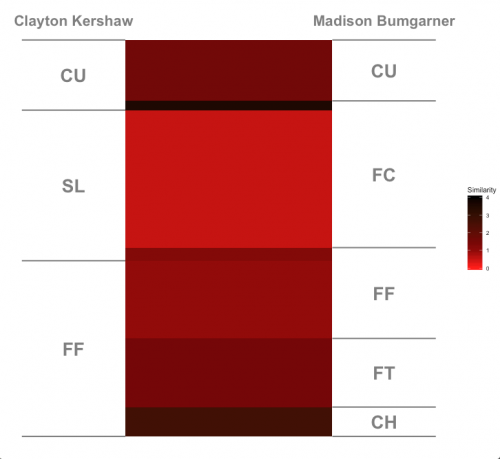
Let’s look at things another way. In the plot below, the shade of red corresponds to the similarity of the pitches, and the size of each section corresponds to its weight in the overall score. From this view, we can see that Bumgarner’s cutter and Kershaw’s slider are especially similar, even more than their four-seamers or curveballs. In contrast, Kershaw’s curveball and Bumgarner’s cutter are very dissimilar, though this has only a small overlap and small weight.
Finally, we ask ourselves: does our scoring method meet our criteria? If two pitchers have similar pitch frequencies, then similar pitches line up across from similar pitches, giving the best chance at a good score. Our first property is met. If two pitchers throw similar pitches, then their overall scores have the best chance at being good (at least when those pitches are lined up across from their counterparts). Our second property is met. Finally, since any pitch can be lined up across from any other pitch, we have an opportunity to capture similarity between different pitch types. Our third criteria is met.1
Results
Before we walk through some preliminary results, a couple of notes: first, we only compare lefties to lefties and righties to righties. We could have calculated similarity scores for opposite-handed pitchers, which would certainly classify them as dissimilar anyway. Or we could have flipped their horizontal breaks to compare apples to apples. Ultimately, due to platoon splits, we decided this would have little value. Second, keep in mind that a lower score means greater similarity. Third, we threw out R.A. Dickey and Steven Wright, because knuckleballers are weirdos.
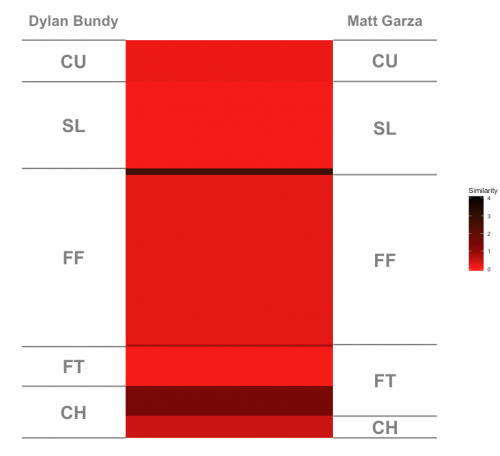
The most similar right-handed pitchers are Matt Garza and Dylan Bundy, with a score of 0.36. Take a look at their similarity plot below. If Bundy threw a couple more changeups and a couple fewer two-seamers, they could basically be the same pitcher. Their frequencies are near identical, and their pitches are remarkably similar.
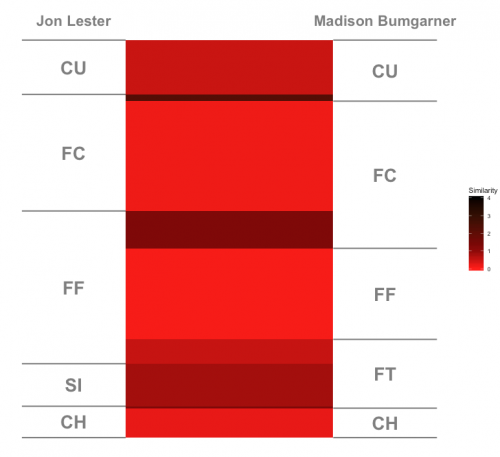
It’s a similar story with the most similar lefties: Jon Lester and Madison Bumgarner. Their score was 0.44. They throw the same pitches—at least, other than Lester’s sinker and MadBum’s two-seamer, which end up being similar anyway.
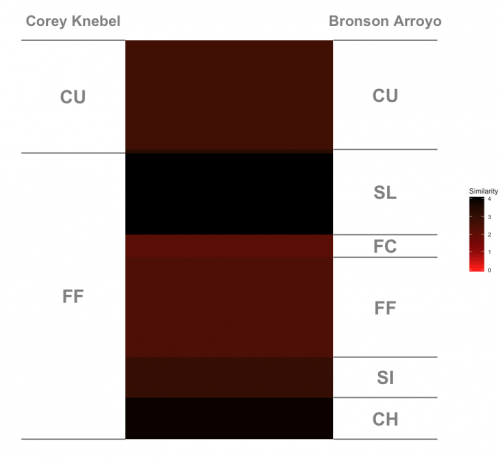
The most dissimilar righties are Bronson Arroyo and Corey Knebel, shown below. Their similarity was a whopping 3.01, as they didn’t match up at all. Even though they had a lot of curveball overlap, Knebel throws his lot harder (80 mph vs. 72 mph) and with a lot more break than Arroyo.
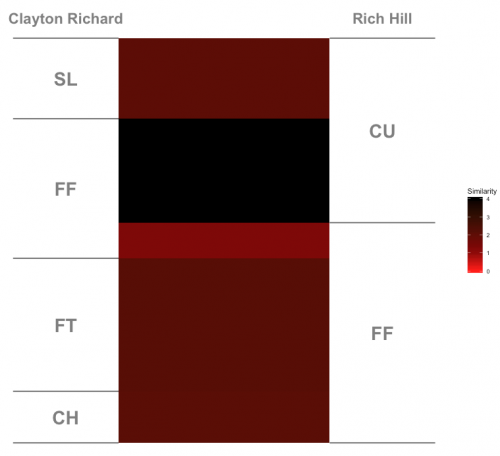
The most dissimilar lefties were Clayton Richard and Rich Hill, similarity 2.69. Hill is an odd duck, throwing only a curveball and a fastball with any significant frequency. That’s a recipe for dissimilarity off the bat, and when compared to Richard, they don’t line up at all.
For more comparisons, use our Pitcher Similarity Score Viewer to look up your favorite pitchers!
Footnotes
- A quick methodological detail: in our plots, we ordered the pitches such that similar pitch types are more likely to end up next to one another. The order: changeup, sinker, two-seamer, four-seamer, cut fastball, slider, curveball. ^
Code for this article can be found at my Github page.
39 thoughts on “Pitcher Similarity Score Methodology”
Comments are closed.