I. Introduction
If you didn’t know, there are a lot of people in the world—7.6 billion to be exact! There are also a lot of people that play hockey. As a result, there are a lot of hockey leagues in the world. Wow. Okay, moving on… The National Hockey League (NHL) is seen as the premier hockey league in the world, but players don’t start their hockey career in the NHL, and most never make it to the NHL. Some would argue that it is possible to have a successful and prosperous hockey career even if you never play in the NHL. In this article, I attempt to quantify the differences between these leagues; more specifically, translating individual player production from one league to the next. This would allow us to say things such as Tony Cameranesi registered 50 points in 50 games, or 1.0 point per game, in the NCAA, thus you would expect him to produce xx amount in the AHL, yy amount in the KHL, zz amount in the NHL, etc.
Everybody is familiar with the NHL, but what are some of the other prominent leagues around the world? The Kontinental Hockey League (KHL), often referred to as the second-best league in the world, consists mainly of teams residing in the motherland, or my birth country, Russia. This league has a number of Russian players that have played in the NHL, and more that could have but chose to stay in the KHL. One example would be Ilya Kovalchuk, who recently signed with the Rangers to return to the NHL. A couple of other highly competitive leagues in the world are the Swedish Hockey League (SHL), Liiga (Finnish League), DEL (German League), Czech Extraliga (Czech Republic League), and the American Hockey League (AHL), a minor league to the NHL.
Most countries with prominent professional hockey leagues also have lower-level professional and amateur leagues. In the United States, we have the AHL, Eastern Coastal Hockey League (ECHL), Federal Hockey League (FHL), and Southern Professional Hockey League (SPHL) serving as our professional leagues below the NHL. The NCAA D1 and D3 hockey leagues come next in terms of age, followed by Tier I Junior Hockey, also known as the United States Hockey League (USHL). Tier II is the North American Hockey League (NAHL), and then at the Tier III level there are a bunch of leagues, notably Eastern Junior Hockey League (EJHL) which has become part of the United States Premier Hockey League (USPHL), and the North American Tier III Hockey League (NA3HL) to name a few. USA hockey also has a development hockey program based in Ann Arbor, Michigan. It’s a program funded by USA Hockey that offers the top US-born hockey players the opportunity to have top notch training and play against older Tier I and II junior hockey leagues in addition to international competition. The program has U17 and U18 teams. At the high school level, you have US High School leagues, which, aside from Minnesota High School hockey, consist of relatively poor competition. Because of this, many American teenagers forego High School hockey to play Tier I U18 Hockey or Prep School Hockey, likely for a New England Prep School such as Taft, Choate, the great Shattuck St. Mary’s, etc. Unfortunately, for many kids, this requires extensive travel time and expenses, one of the reasons hockey is less popular in most of the United States. Below that is Midget (15 – 16), Bantam (ages 13 – 14), Peewee (ages 11 – 12), Squirt (ages 9 – 10) and Mites (ages 8 and under). Most countries follow a similar pattern of league age groupings.
Given this complex web of leagues, you can imagine that a player will play in many leagues over the course of a career. For reference, let’s take a path down Marc’s memory lane. While I was playing junior hockey in the EJHL, I encountered a player in late October that beginning in August had started by playing in Alaska in the NAHL, then was traded to Minnesota in the Minnesota Junior Hockey League (MNJHL), next to Ontario, Canada in Ontario Junior Hockey League (OJHL), followed up by a car ride down to Philadelphia to the Atlantic Junior Hockey League (AJHL), with a final pit stop in Springfield, Massachusetts to join me in the EJHL. These transactions all occurred roughly within two months. While these scenarios do not lend themselves to evaluate translation between leagues, they do illustrate the mass number of leagues in the hockey world!
II. Previous Research
I’d be remiss if I were to say that Model 284 was the first to tackle hockey league translation factors. Rob Vollman is really known as the pioneer of NHL equivalencies/translation factors. He recently posted his translation factor equivalencies. Others have attempted to quantify this problem as well, for example http://www.behindthenet.ca/projecting_to_nhl.php. So why bother if these already exist? Well, for one, I already compiled the data and it never hurts to reproduce results. Additionally, previous research only contained the more prominent leagues in the world, but I wanted to take a broader view that incorporates more leagues. How will an NCAA D1 transfer play at the DIII level? Or an NA3HL player perform in the Norway GET league (as Model 284’s number 1 fan Peter Lindblad did). Third, not to discredit, but I believe some of these studies can be improved with more extensive and recent data, along with a different method of calculation. Previous work has been presented as translating to the NHL but by looking at the comparison of points per game between all leagues, we gain additional information on the relationship between leagues. For better or worse, the sheer amount of leagues is what makes this study interesting compared to previous research.
III. Data
Hockey data outside of the top leagues (NHL, AHL, SHL, Liiga, etc.) is not always available or reliable. Nevertheless, the data used in this study was compiled from a number of different sources: including Hockey Reference, Elite Prospects, HockeyDB, the draftanalysis.com, mnhockeyhub.com, pointstreak.com, nhl.com, other respective league web pages, and more. Over the course of my life, I believe I have cultivated a semi unique database of player statistics from numerous leagues, but maybe not. Anybody that has played hockey at any level knows the reliability of the data is extremely questionable. I have done my best to validate some of the data points to improve the accuracy of the data. The data includes Height, Weight, Hand, Position, Games Played, Goals, Assists, Penalty Minutes, Plus / Minus, Central Scouting Service Ranking, Position, League, Nationality, and any other information I could get my hands on (e.g. NHL combine performance). For this study, we will primarily be using the Games Played and Points Produced in each League to get a Points Per Game metric by league for each individual player.
IV. Methodology
The process starts by calculating each individual player’s points per game grouped by league, or their career points per game in each respective league. For each player, we have a point production by league by season, as seen below for Model 284 follower and Los Angeles Kings defenseman Christian Folin:
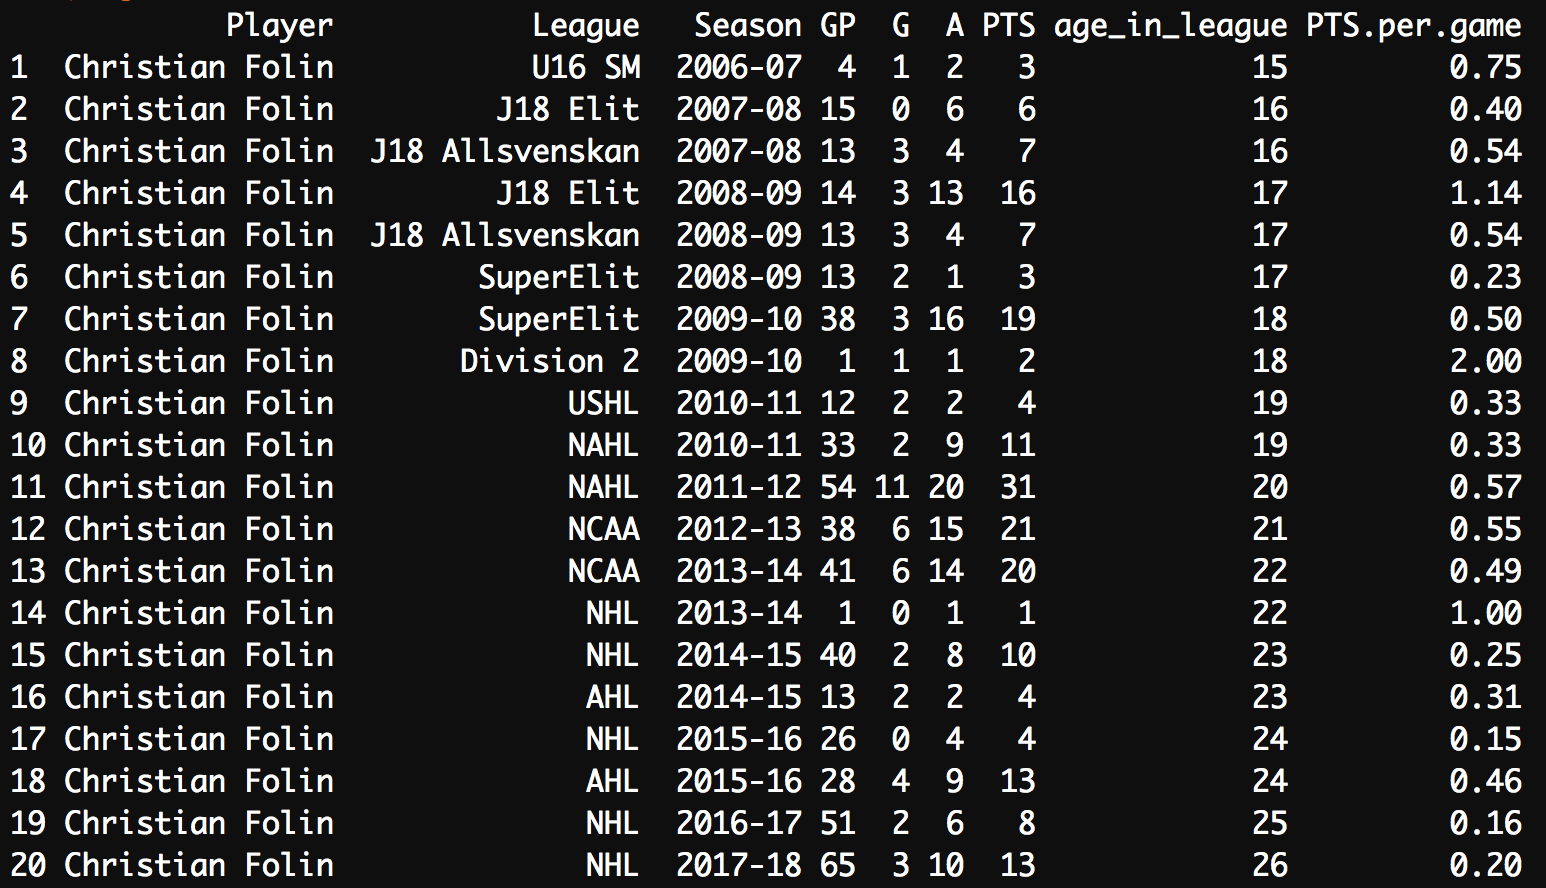
We then condense the data to the league level in order to get points per game by League. After applying this to all players, we then can start comparing point production for players across leagues. The easiest place to start is probably the AHL and NHL. Below is a scatter plot of points per game for a subset of a couple thousand players that played in both leagues. Obviously, the more games played in a league, the more stable your points per game will become. The points are scaled in size by number of games played in the AHL and colored by number of games played in the NHL (the lighter the blue, the more games played). The line represents a one-to-one line of points per game in the AHL to NHL.
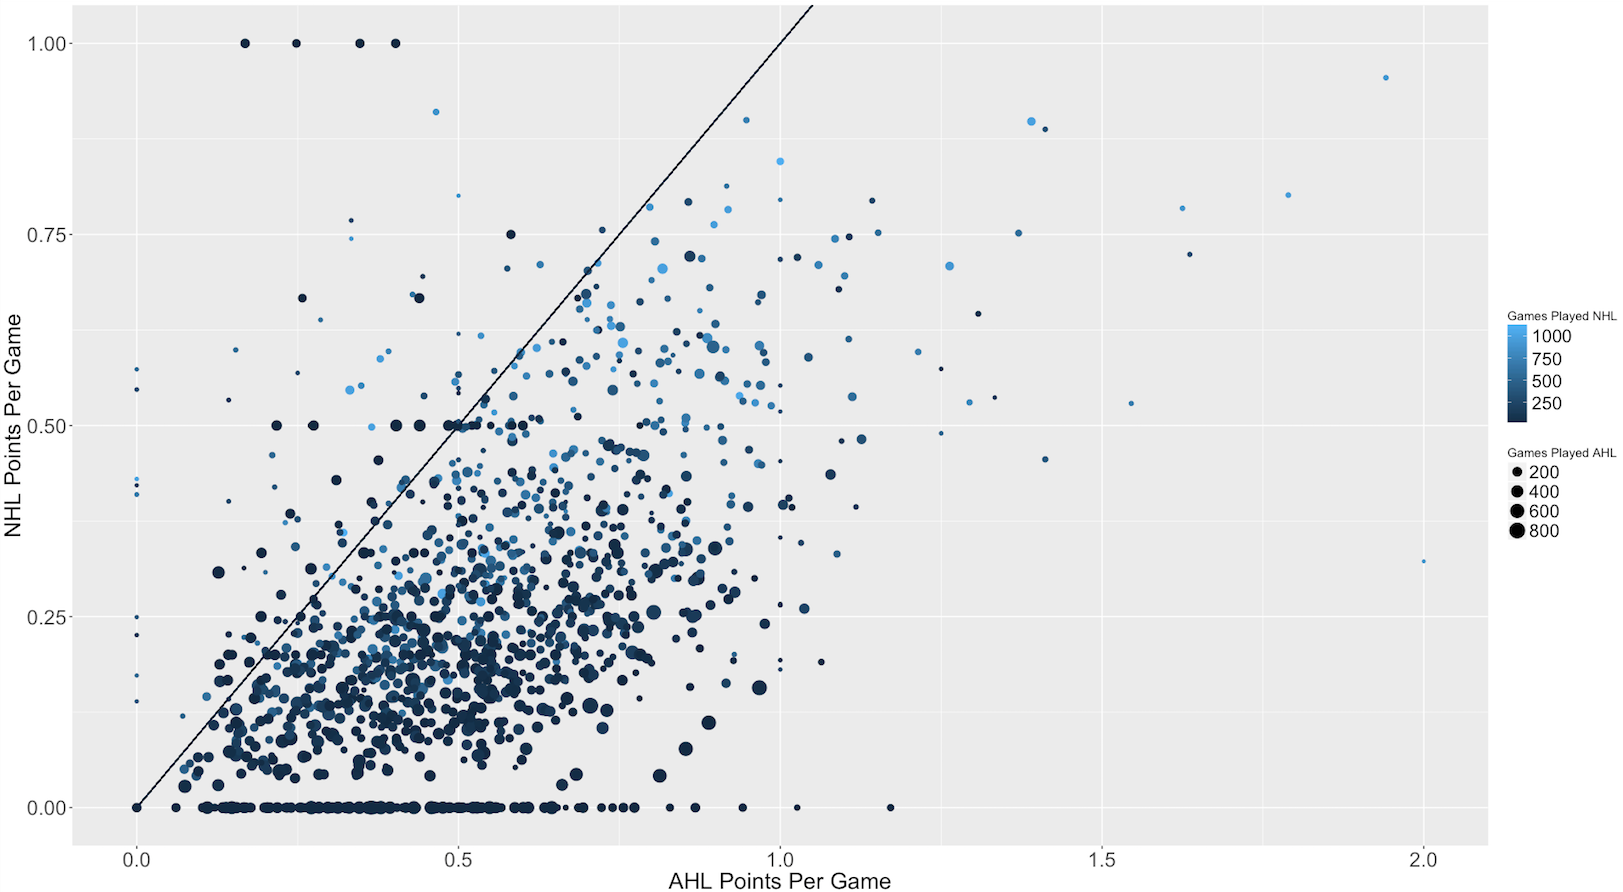
A point in the AHL is not exactly equal to a point in the NHL. By fitting a regression line to the above plot (after adding in the other thousands of players), we have the following model:
NHL_Points_Per_Game = 0.052 + 0.386*AHL_Points_Per_Game
This gives us an equation to translate point production in the AHL to the NHL. We can also apply this method to all leagues compared to the NHL, and eventually, comparisons between other (non-NHL) leagues as well. By incorporating comparisons between other leagues, we gain more information about the translation of leagues across the world. Additionally, these should give us an estimate of how a player playing in one junior league might produce in another junior league.
To do this, we can expand our regression to be run against all combinations of the leagues in our data. For each league comparison, we must force the intercept of our model to 0, and then calculate the coefficient for each league. You may have noticed some outlying points in the plot above – these are driven by players that only play 1-2 games in a given league. In order to account for these outlying points and more heavily weight “better” data points, we’ll use a weighted regression model, with weights calculated based on a formula that rewards for a higher number of games played in both leagues being compared. From there, we take the coefficients from all leagues and weight them by the number of games played multiplied by the number of players to get a translation factor for each league.
One outstanding issue is that some leagues get siloed into a small comparison network that only considers a few leagues. For example, the NA3HL has limited comparisons outside of NCAA DIII, Minnesota High School Hockey, and Midget hockey. In order to account for this, we make a final adjustment to our translation factor that considers the quality of a given league that is being compared.
V. Results
Below are the results of the Top 10 Hockey Leagues as ranked by our Translation Factor:
![]()
As expected, the NHL comes out on top, followed by the World Cup of Hockey, and SHL. The KHL falls just below the SHL (likely driven by the extremely low scoring in the SHL). In terms of world competition, as mentioned, the World Cup comes out ranked just behind the NHL with the World Championships and Olympic Games ranking 5th and 7th. This might be due to less NHL players participating in these events compared to the World Cup, which occurs outside of the NHL season.
Certainly, a comparison of the top leagues is interesting, but remember, we have a couple hundred leagues to consider. Therefore, comparing amateur and lower professional leagues might be the more interesting application of this study. To start, below is a list of 20 leagues in the United States (note these are not all the leagues in the United States, but represents a subset of the prominent leagues at different age levels):
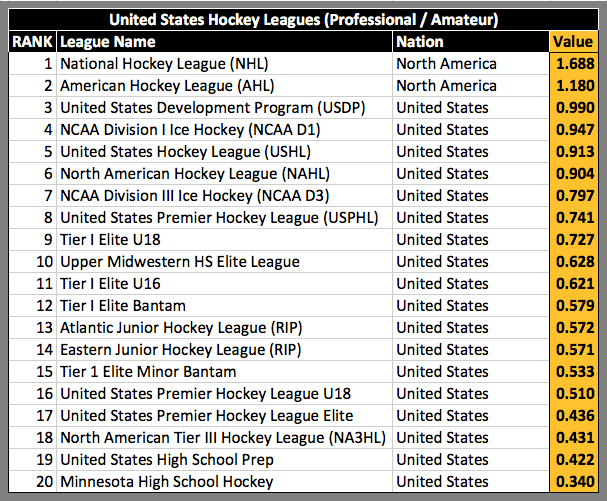
Interestingly, The NAHL, a Tier II Junior Hockey league in the US, ranked nearly equal to the USHL and NCAA D1. But lets add some context around why these translation values could’ve shook out this way. First, remember these translation factors are not exactly rankings of leagues. In the next sections of this article I discuss how league scoring, changes in the league over time, and age affect the translation value. In our data the sample of players that played in the NAHL is slightly younger than what is typically seen in today’s NAHL. Additionally, the NAHL produced significantly more NHL caliber players 10+ years ago when the top players were split between which league to play in. Furthermore, sometimes players will play in the NAHL at say, age 16 before playing in the USHL the following season. Obviously, the NAHL does not have the blue-chip prospects seen in the USHL. Still, it isn’t inconceivable that younger players that are not as physically developed struggle more in the NAHL than the USHL because of the older, more physical nature of the NAHL. Lastly, the fact of the matter is the NAHL is likely closer to the USHL than people realize.
Next, let’s float our way over the pond to check out how the Russian leagues shook out:
![]()
The KHL obviously is a top 5 league in the world. The Vysshaya Hokkeinaya Lige (VHL) is the second tier professional league in Russia. For background, most top players in Russia will play in the Molodezhnaya Hokkeinaya Liga (MHL), the top junior hockey league, and then jump to the KHL rather than playing in the VHL. Shockingly (kidding), most United States hockey leagues appear superior to Russian hockey leagues at corresponding levels based on our translation values.
If I haven’t lost you yet, let’s consider a few things before we start blindly translating players across leagues.
VI. Things to consider
- Style of Play
Different leagues have different styles of play. European leagues mostly play on 200-foot-by-100-foot Olympic size sheets, while North American or NHL sized rinks are less wide, with dimensions of 200-feet-by-85-feet. Whether it is a product of the rink size or a difference in the actual play of the game, the common notion is that European leagues are more skilled and less physical than North American hockey leagues. To get a feel for the difference in scoring by league, below is a plot of goals per game for a subset of leagues around the world:
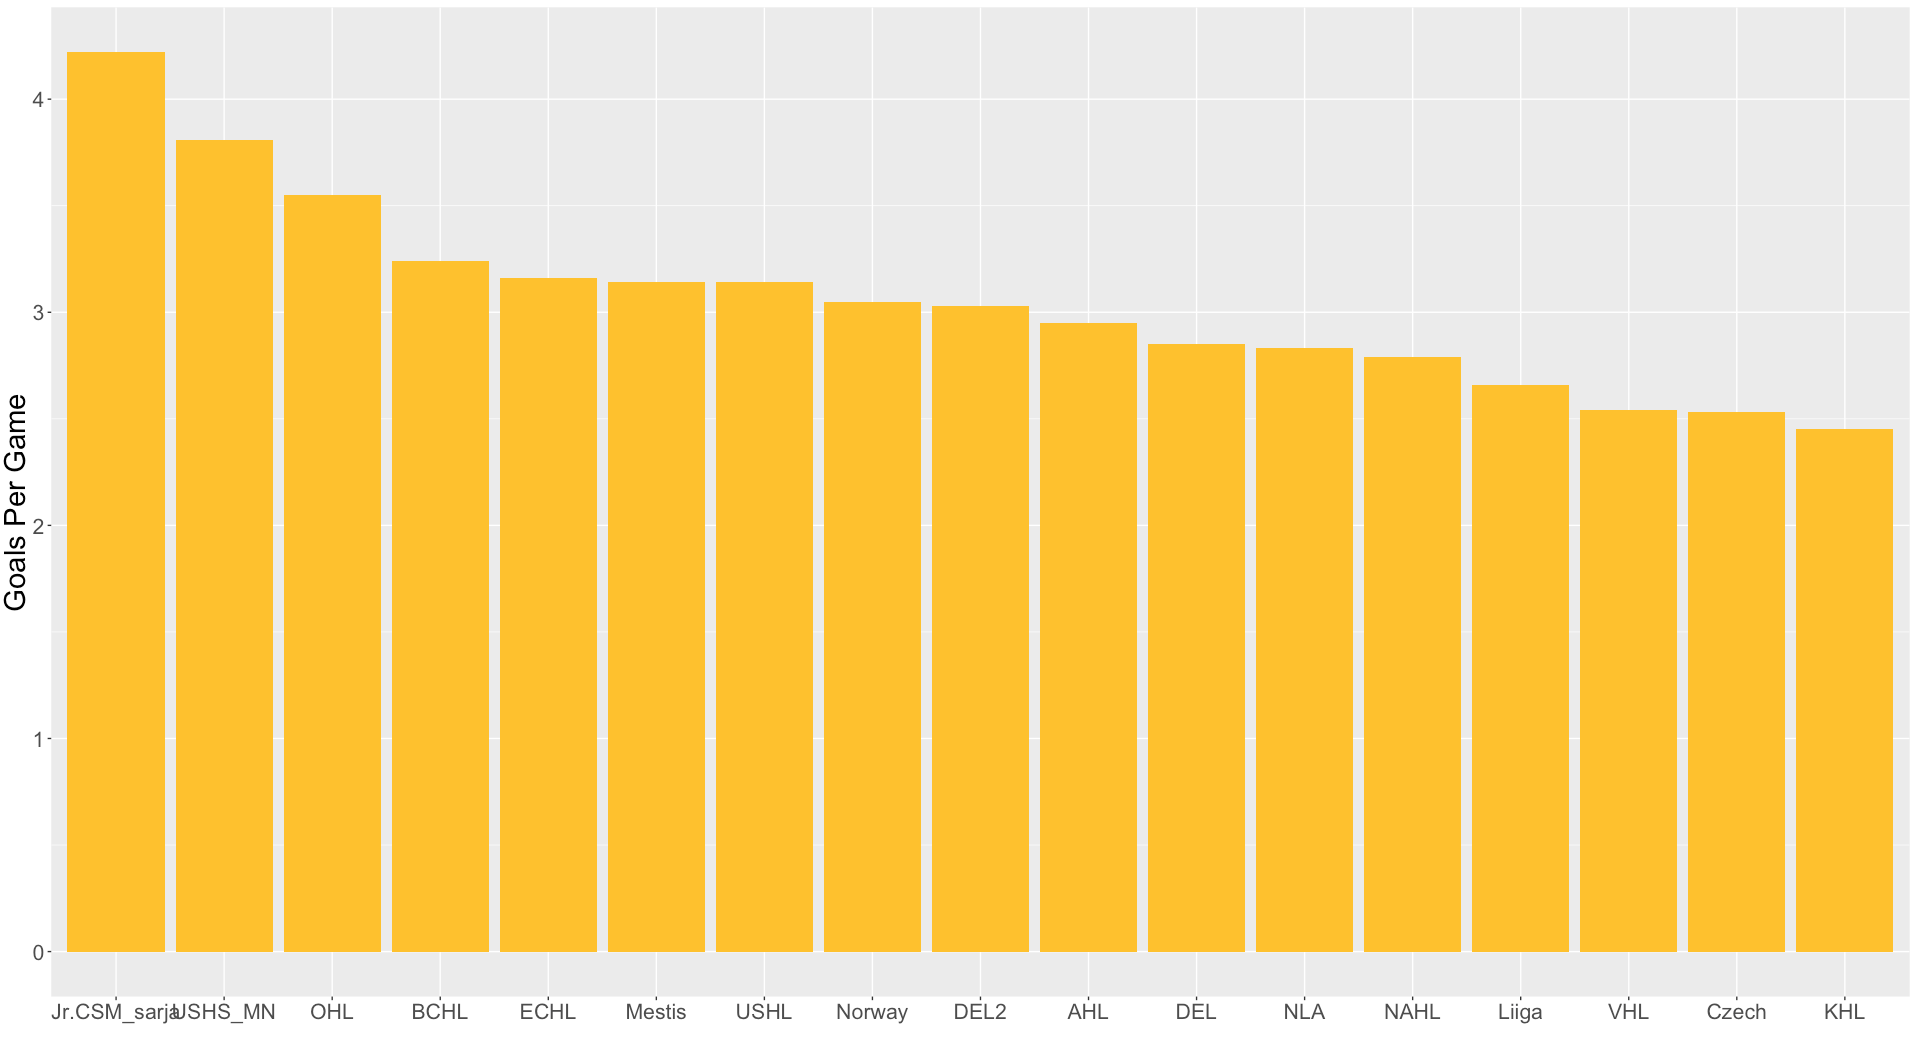
Scoring ranges from about 2.5 goals per game to just over 4 goals per game. It is difficult to tell if there is really any difference in scoring based on region.In most sports, the general theory is that the better the league, the tougher it is to score, but, given the number of factors in hockey, this may not always the case. Below shows the average number of goals per game on the y-axis and our translation factor on the x-axis. There is a decently strong negative correlation (-0.76) between goals and the translation factor of the league (here is where you see that the USHL is a higher scoring league than the rough and tumble NAHL).
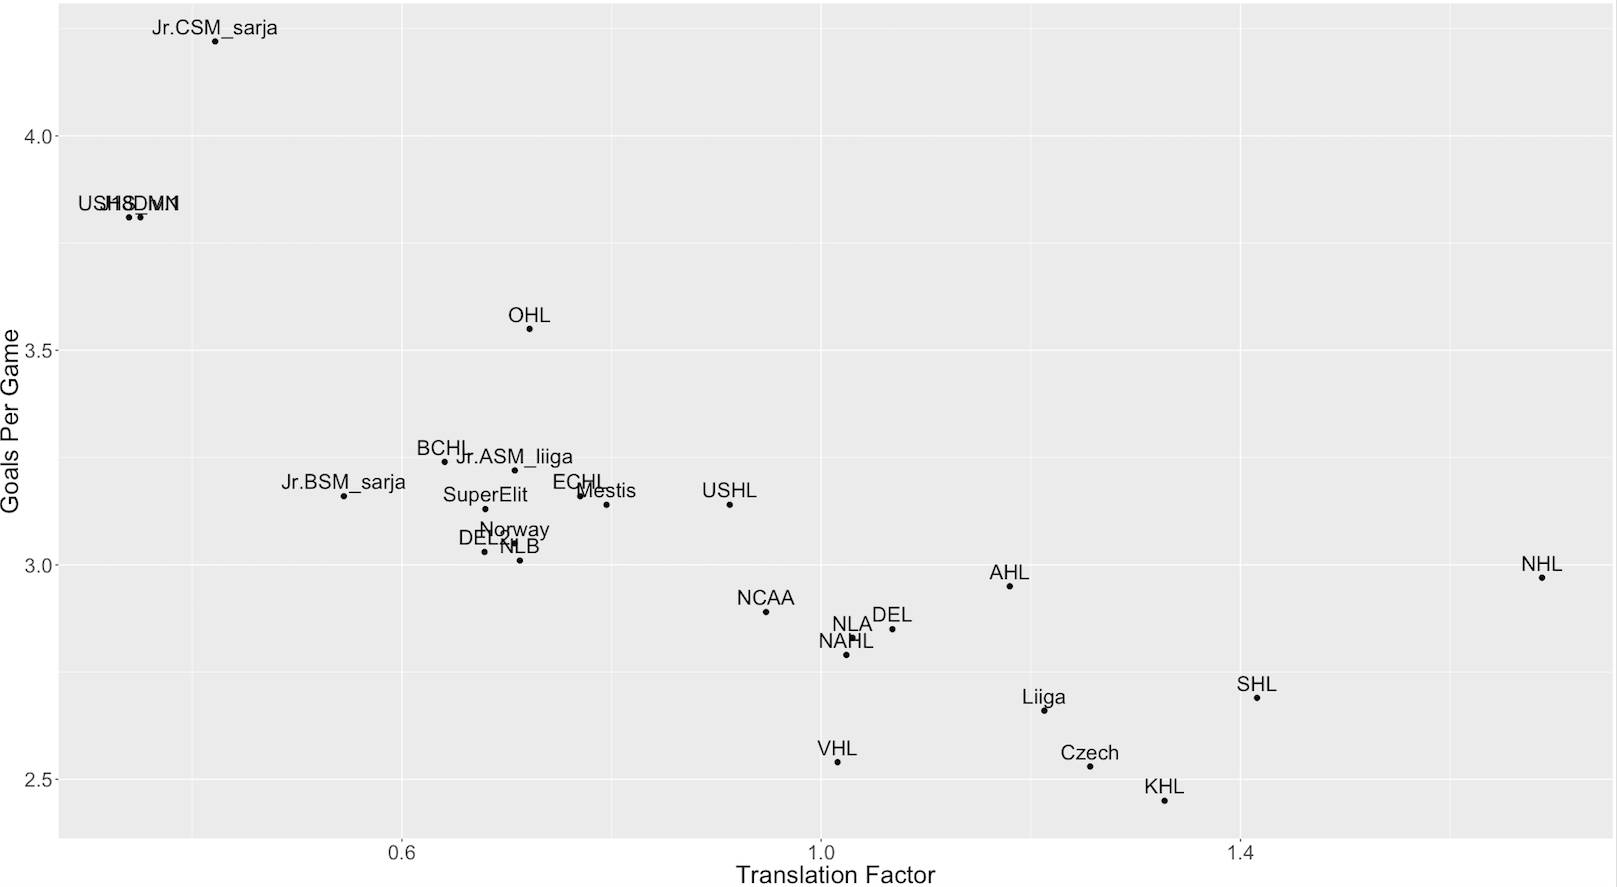
This shows us that some leagues might produce more goals, meaning a player’s points in a given league are influenced not just by the level of play, but also by the overall league scoring environment. These translation factors account for not only the level of play in a given league, but also the number of goals scored in that league.
- Age
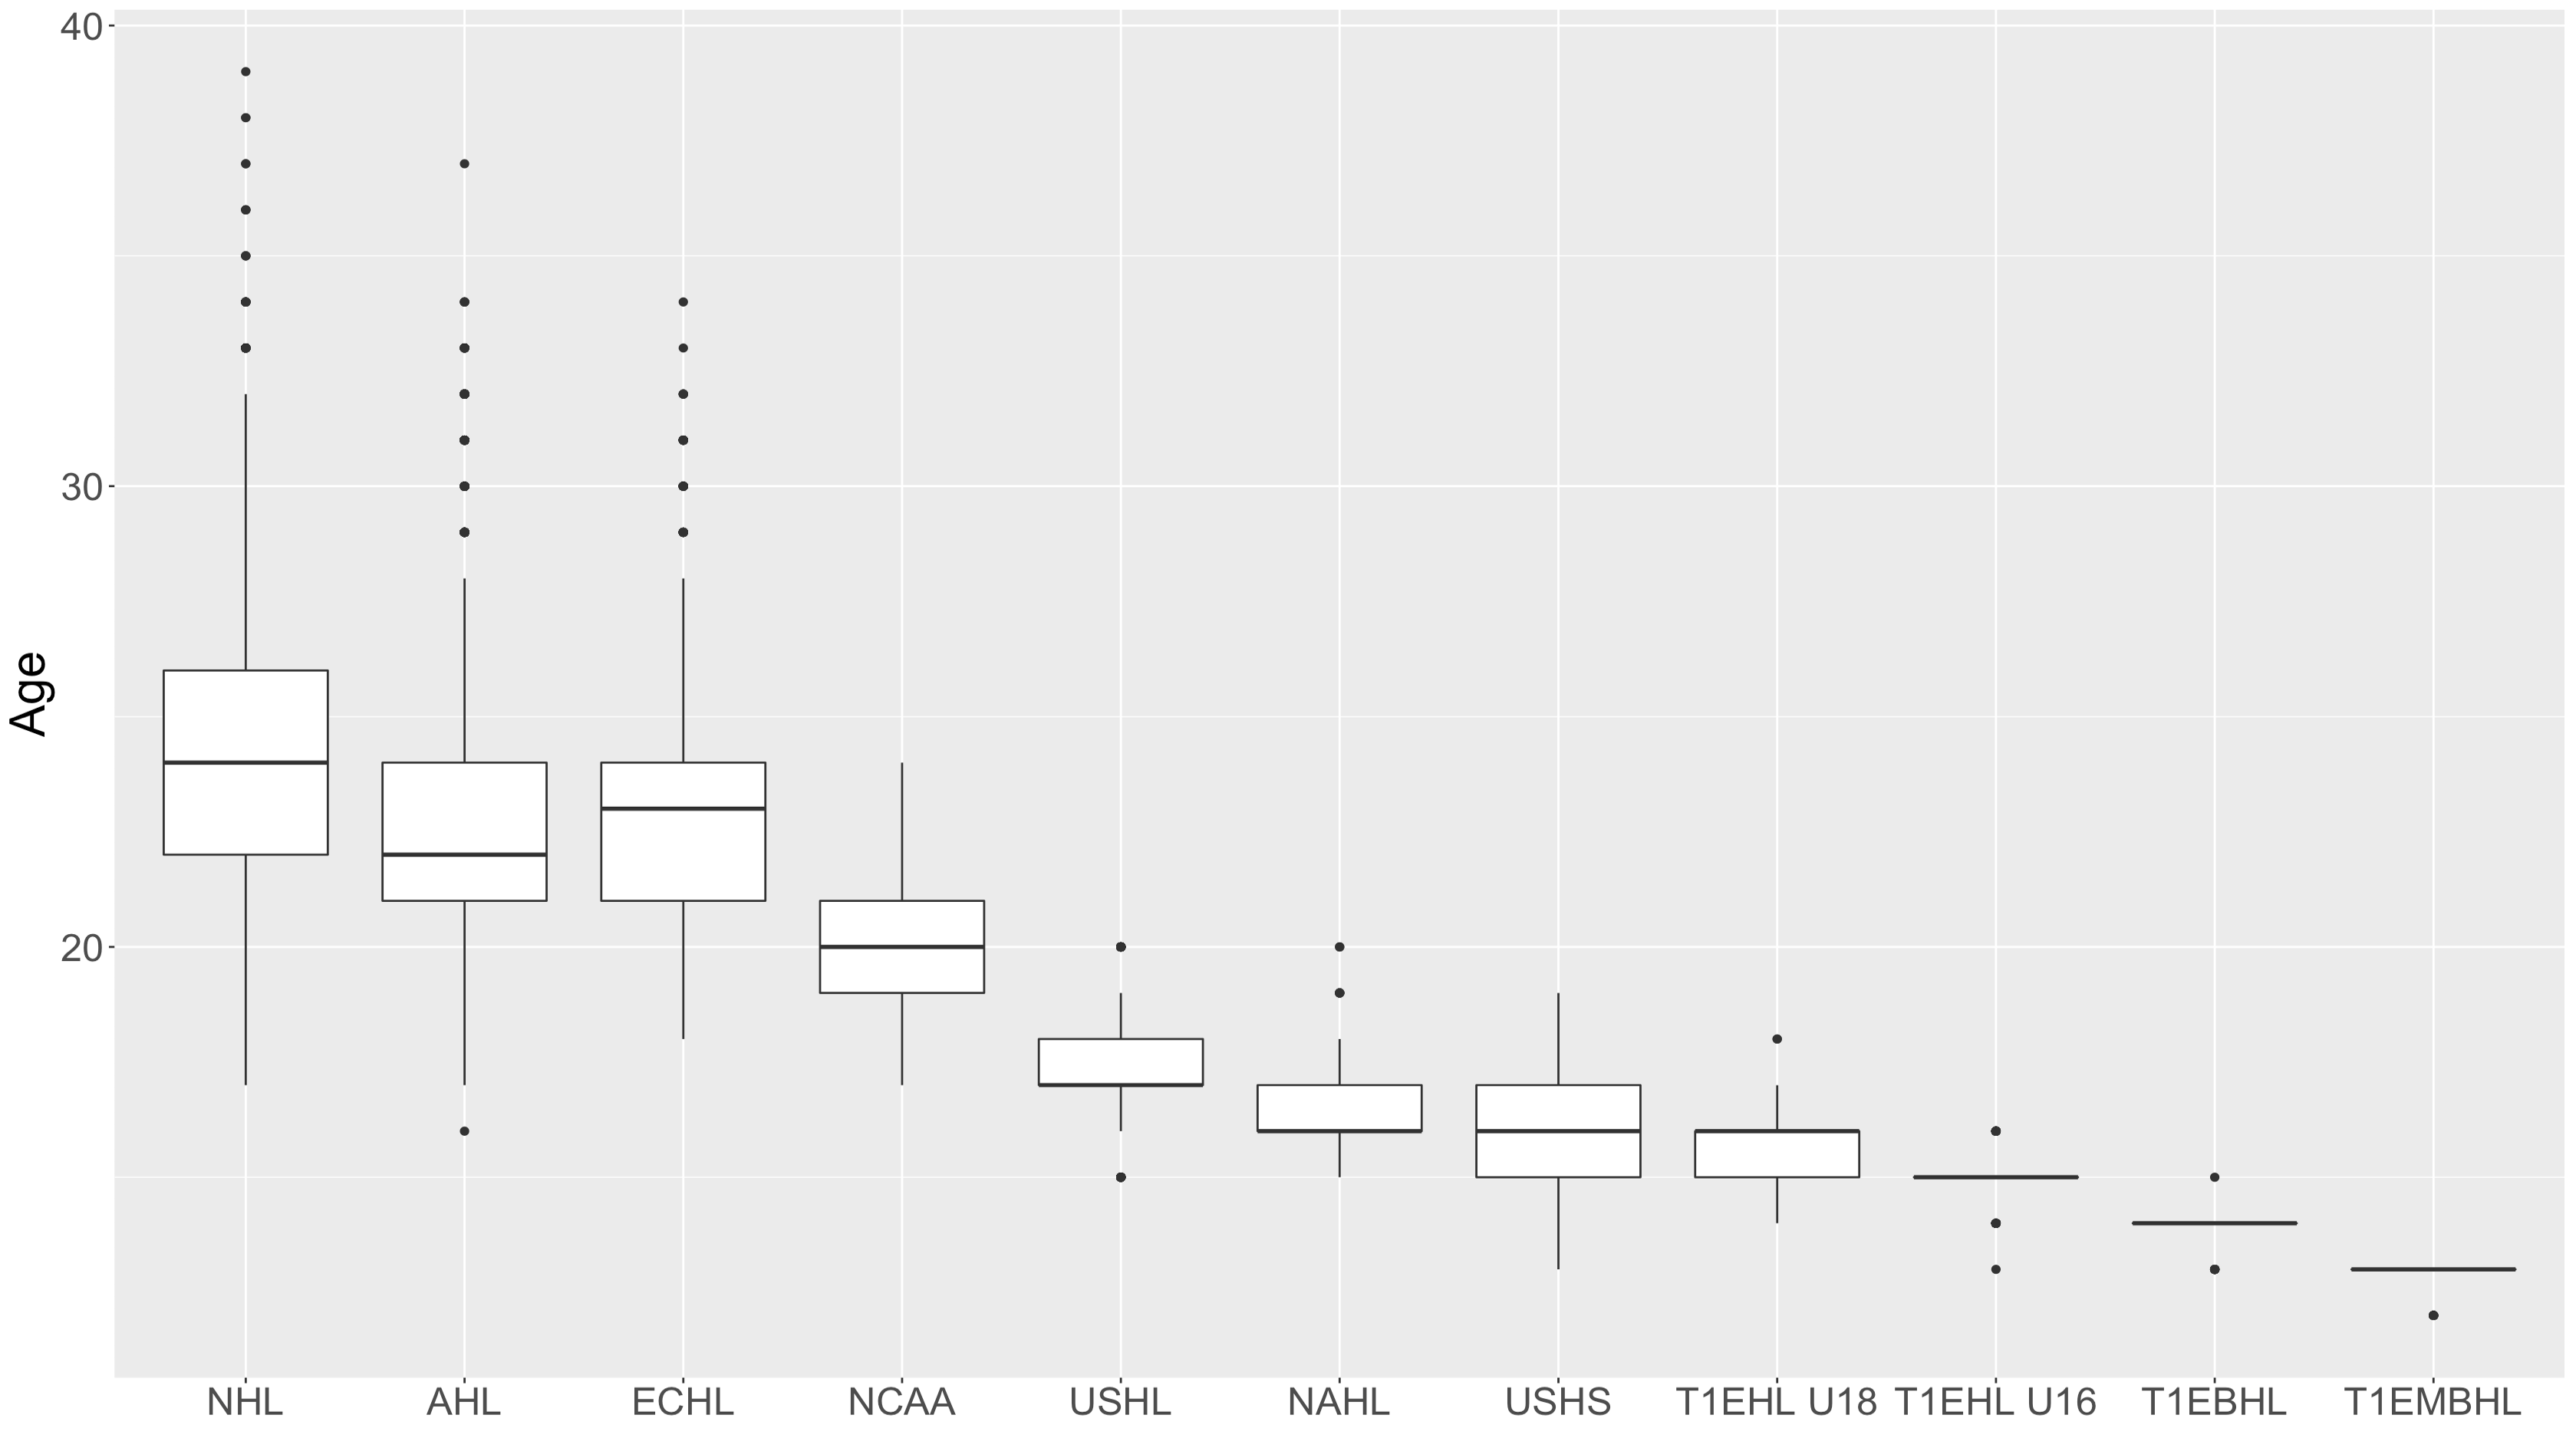
The age of players varies widely across leagues. For instance, most junior hockey leagues have an age restriction of U20; this is universal across the world. Contrast that with the NHL, where, in 2018, the average age was roughly 28 years old. Considering this enormous age gap in leagues, it’s difficult to create a factor that would say 28-year-old Claude Giroux would produce xx amount in the U20 Ontario Major Junior Hockey League (OHL) at his current age. Plus we don’t care about making that comparison since Giroux could never play in the OHL at 28 years old. In our analysis, we are assuming that there is a natural stepping stone in league ages, and thus when dissecting league translation factors, it is important to consider the average age of the league. The box plots below show the age ranges within our data for a subset of United States hockey leagues. The plot below presents an example of a natural career projection of leagues played in for a player in the United States:
On top of the difference of age discrepancies across leagues, especially in junior, high school, and U18 leagues, players also develop physically at different rates. If Player X grows 6 inches and puts on 25 lbs from USHS to the USHL, while Player Y remains the same height and weight, I would expect a greater increase in production from Player X than Player Y, all things equal. Therefore, we use an age adjustment curve for each league to attempt to get players on an even playing field. These age adjustment curves were calculated using a delta method of sorts — methodology article coming soon!
- League Changes Over Time
Like everything in life, hockey leagues change over time. The Russian SuperLeague, for example, now no longer exists, and has blended into what is now the KHL. Even if a league is around for a long time, its level of competition can vary greatly. In 2004, the NHL had a lockout season, which presented a unique opportunity where the top level talent in the world went and played in leagues all over the world. The NAHL has nearly doubled in size over the last 10 years, and the level of competition has appeared to have substantially dropped off. Looking at their NHL Alumni page, there hasn’t been many players from the NAHL playing in the NHL since the 2000–2008-ish era. So, if we want to explore the translation of play for players, do we want to include years where an abnormal influx of talented players is present in a league?
In addition to structural changes in leagues from an organization and player standpoint, league rules have also changed over time. The NHL has rid itself of the two-line pass rule, which in theory increases scoring. The NHL has also implemented 3-on-3 overtime in an effort to increase scoring and excitability of the game. As a result, the number of goals scored per game has changed over time. Below shows the progression of a few leagues’ Goals Per Game since 2000:
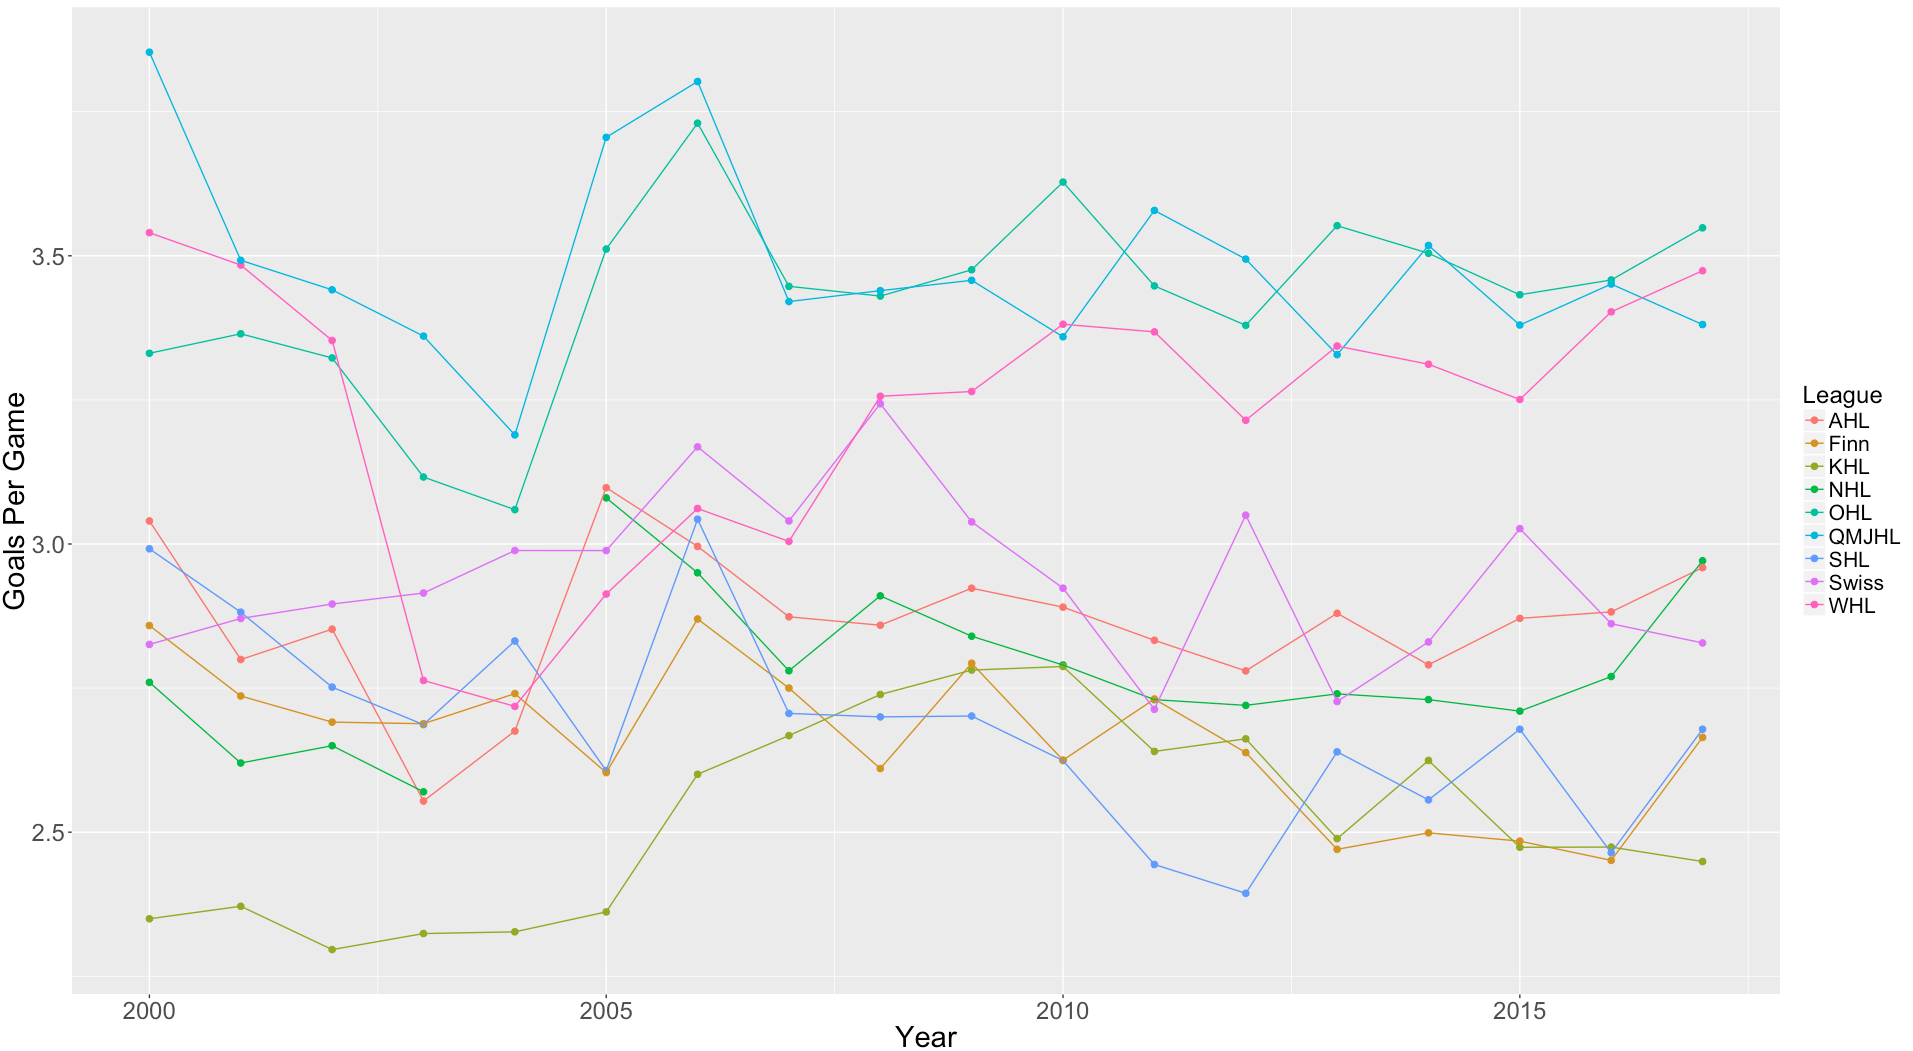
We see some interesting movement, which is likely due to a number of factors such as rule changes, talent level changes, possibly goalie pad size increases, etc. While this movement shows the case for adjusting league numbers to current day, the lack of available data would prevent us from applying this to all leagues. Thus, instead of adjusting to present-day scoring, we look at it as a measure of overall league performance. Additionally, we will not exclude years or differentiating periods of time for leagues. It is important to understand that these translation factors are representative of a period of time and might not be up-to-date to the current leagues, but I believe that the time element is not a big enough factor to render these translation factors useless.
VII. Application
Since the disclaimers are out of the way, it’s time to put these translation factors to the test! Suppose Player X produced 0.7 points per game (PPG) in the AHL and we want to know how Player X will translate to the NHL. First, we need to take into account Player X’s age, because producing 0.7 PPG at age 19 vs age 28 is vastly different. After adjusting point production by age, we then take our age-adjusted points per game and multiply it by the AHL translation value (1.188) divided by the NHL translation value (1.688).
Player X likely didn’t start his career in the AHL, and therefore, we should have that player’s point production in other leagues. If we have a player’s point production from multiple leagues and years, we can take each year’s point production (adjusted for the given league’s aging curve), adjust for games played and recency, and ultimately produce a “better” prediction for PPG in the NHL.
For our first test, let’s apply our methodology to the 2010 NHL draft (these players have reached our database’s average NHL age, 25). Using the methodology outlined above, utilizing multiple years and leagues where applicable, we can create an NHL PPG estimate for each player (using leagues they played in prior to being drafted). Below shows the first round of the 2010 NHL Draft, and their predicted PPG, last year in the NHL PPG, and career PPG:
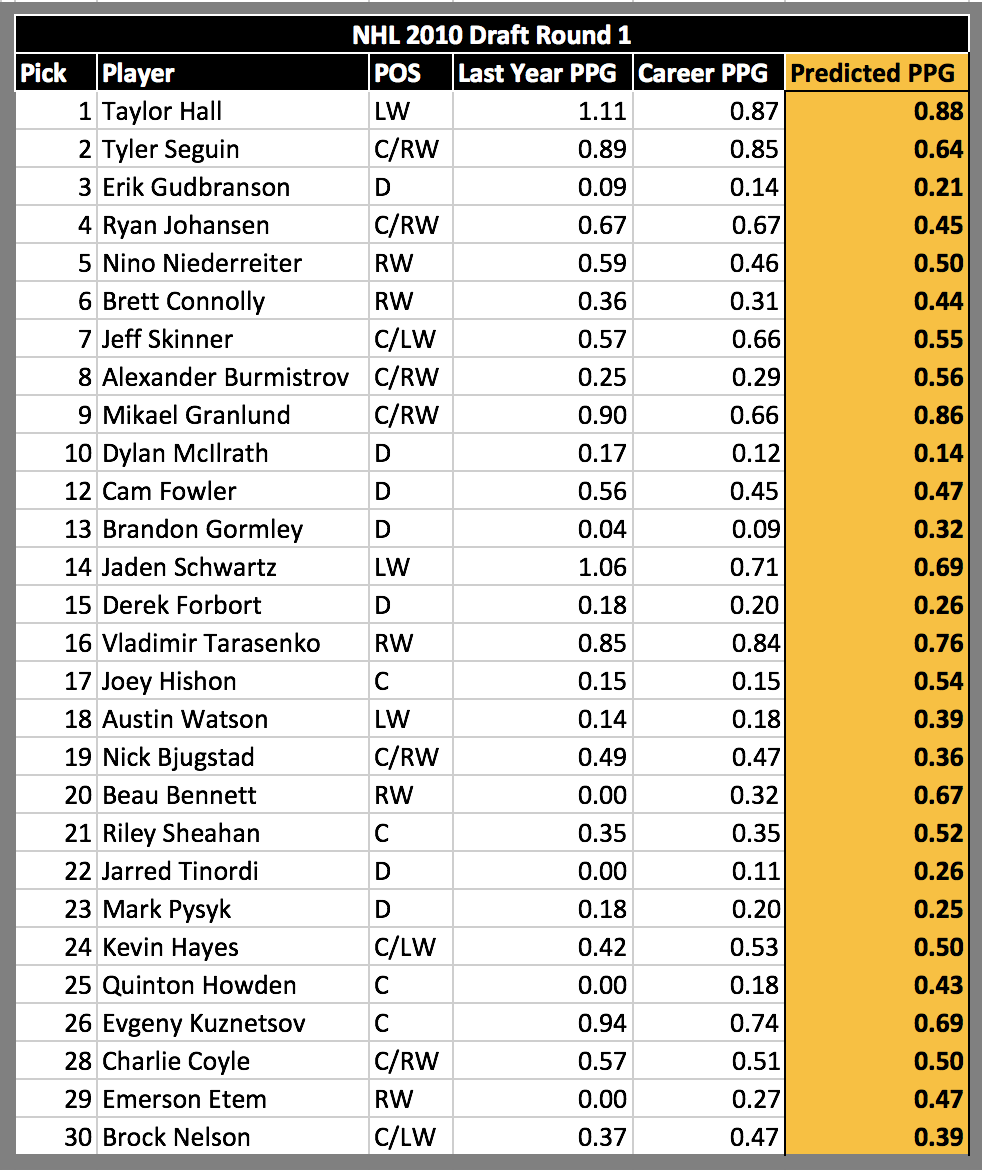
Unsurprisingly, the Russians, Vladimir Tarasenko and Evgeny Kuznetsov, come out among the top predicted points per game prospects, despite being drafted in the latter half of the 2010 first round. Even more unsurprising, the predictions do not get too extreme on either end. Overall, the predictions look relatively solid and even promising relative to the draft order.
Similar to the MLB, most NHL prospects do not play in the NHL immediately after being drafted. In most cases, it takes at least a couple of years before making the jump to the NHL. While it’s obviously important to evaluate prospects before the draft, it may be equally as important to continue to evaluate prospects after the draft. Using our translation factors, we can update our predicted PPG as prospects age. The table below adds a column for one year (age 19) and two years (age 20) after being drafted:
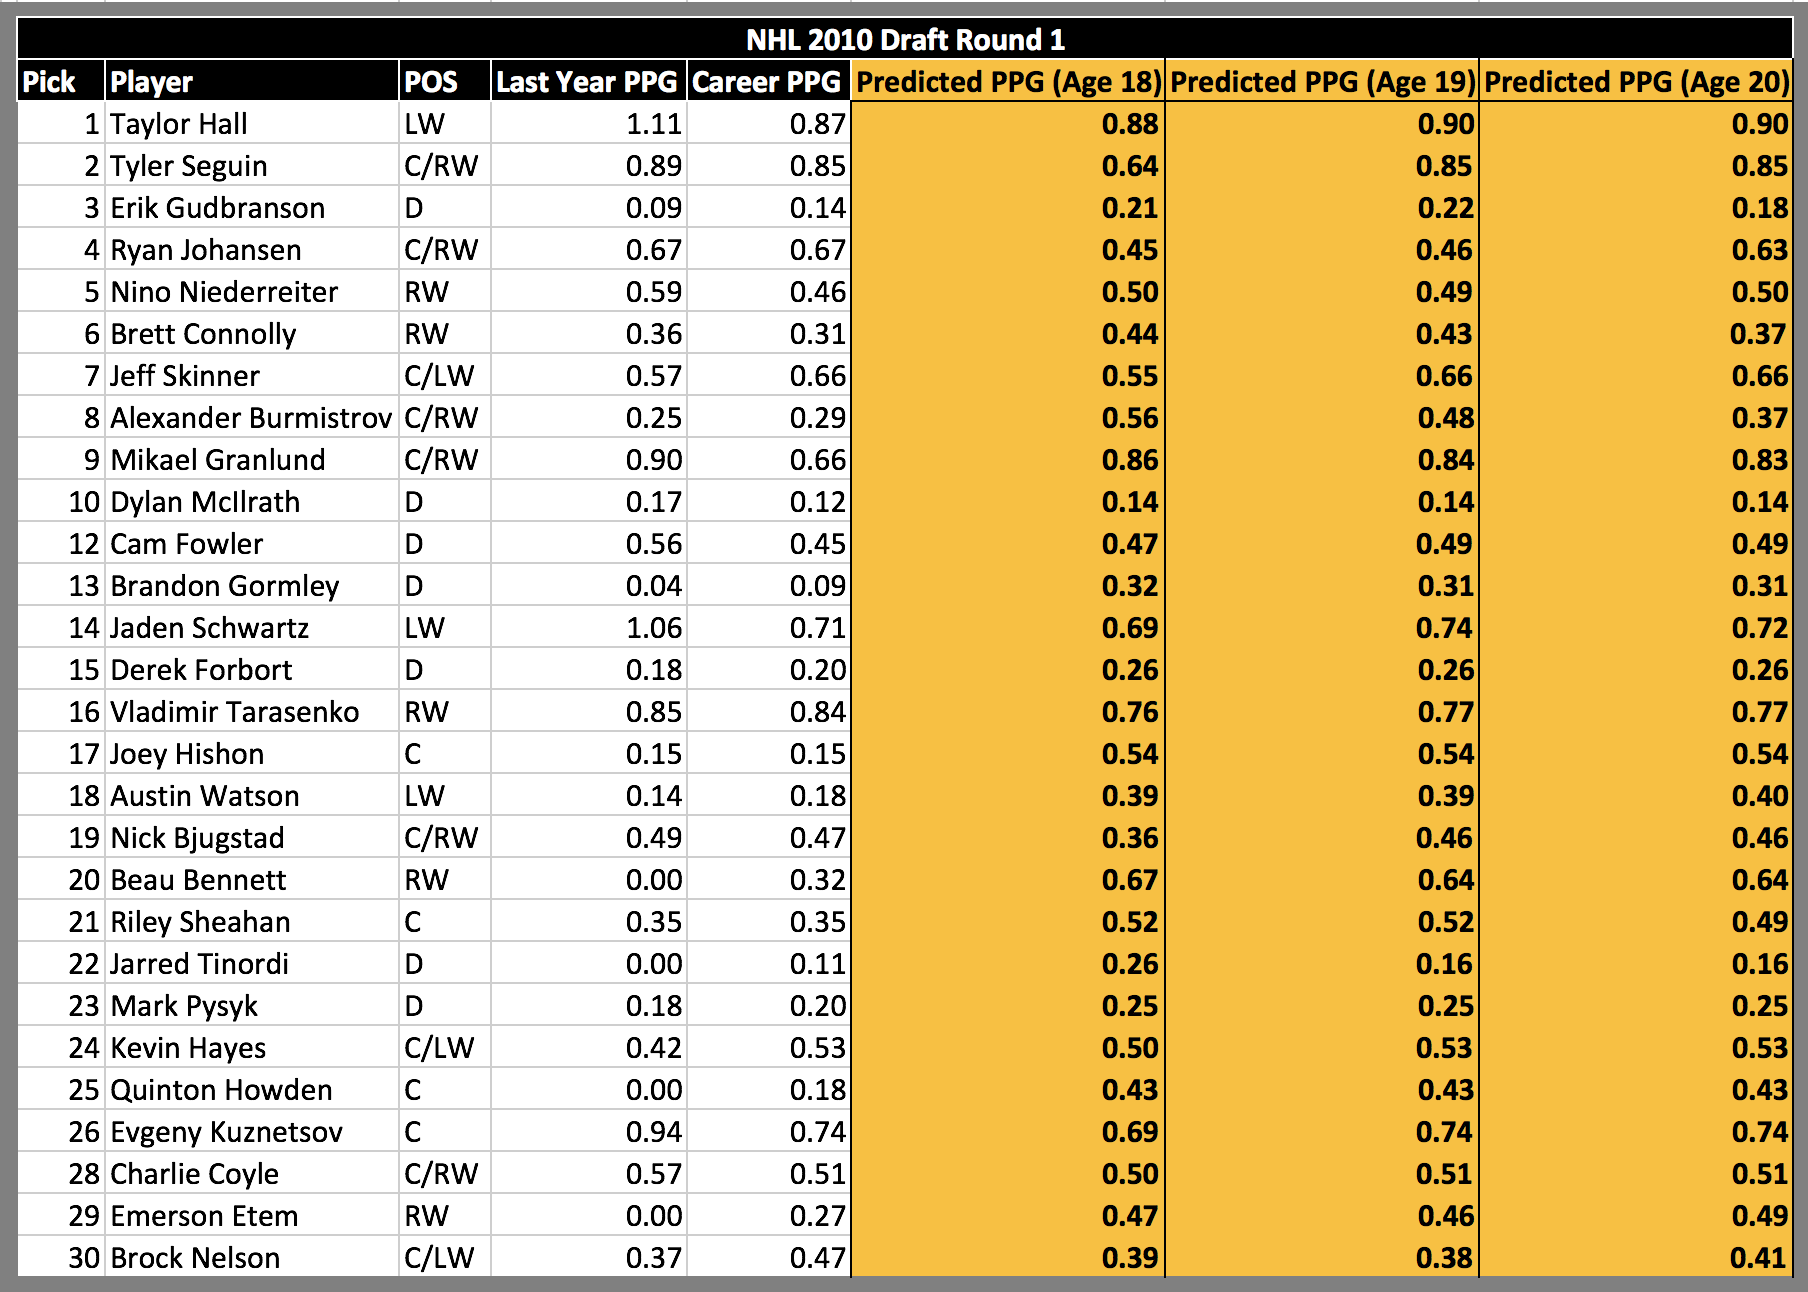
Tyler Seguin’s prediction was light at age 18, but after another year, his predicted PPG quickly rises to support his 2nd overall selection. Big Ryan Johansen, likely still growing into his body, makes a significant jump in points per game at age 20 where he showed promise as a 6’3″ 220 pound Center, and averaged 0.31 points per game in the NHL. Brett Connolly, who was drafted 6th overall by the Tampa Bay Lightning, was a big miss. His predicted points per game was low before being drafted and continued to fall off. While certainly not perfect, our translation factors appear to be given a fairly good benchmark of PPG for NHL prospects.
Now, the most immediate application is to project players to the NHL, but it may have even more impact in leagues that have less scouting resources, such as NCAA DIII Ice Hockey. As previously mentioned, I played DIII Ice Hockey at St. Olaf, so naturally I wanted to see how my teammates and I would project to the DIII level given our High School and Junior hockey performance. Starting with myself, the table below shows my statistics in the leagues I played in prior to my time at St. Olaf, the EJHL and Minnesota High School hockey:
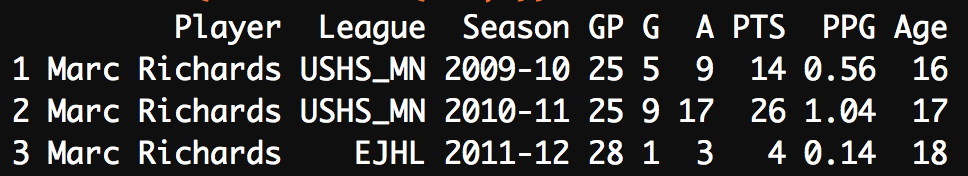
Applying the aforementioned translation methodology, we would’ve predicted that I average 0.23 Points Per Game at the NCAA DIII level. According to elite prospects, I averaged 0.31 Points Per Game, slightly above the predicted amount. A number of factors could contribute to the difference but at the end of the day it is in the ballpark. Let’s try a few more former St. Olaf Hockey Players:
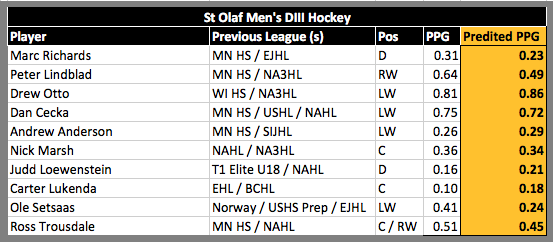
Recent St. Olaf graduate Drew Otto, Left Wing from Menomonie, Wisconsin, averaged 0.81 Points Per Game across his four years at St. Olaf. Based on his performance in the NA3HL and Wisconsin High School hockey, we would’ve expected about 0.86 Points Per Game from Otto at the NCAA DIII level. The biggest miss among notable players I played with was Norwegian Winger Ole Setsaas and Morris Benson star Peter Lindblad, who averaged 0.41 and 0.64 points per game at St. Olaf but projected to only average 0.24 and 0.49 points per game, respectively. Interestingly, Peter and Drew played for the same team, albeit different seasons, prior to coming to St. Olaf.
VIII. Final Thoughts
Hockey Translation League Factors are a useful tool that can be misleading if not handled by the right person, with the right care. As with any model, one must understand the assumptions and inner workings to dissect the model’s output properly.
Hockey is a complex team game with multiple roles; thus, there is value beyond point production. When translating how a player will play in the NHL, we should also consider other factors such as size and physicality to help in our player projections. Stay tuned for Model 284’s NHL Draft Model that will incorporate some of those aforementioned variables to project NHL performance beyond point production. In addition to the NHL Models, these translation could be especially useful for NCAA DIII coaches or even junior hockey coaches look for another view point on a player.
Russians are the key to winning.
71 thoughts on “Hockey League Translation Factors: Methodology”
Comments are closed.