Throughout the 2017 NBA Playoffs, we have been tweeting spread and total predictions for some games (e.g., Warriors -11, Game Total 220). This article provides some context to the numbers – how accurate are they? How are they being created? How are they interpreted? Do we use a Gregg Popovich variable? You can find all the answers below.
Making the Predictions
First off, we make a 10-point adjustment for any game that Tim Donaghy was reffing (just kidding). Our models use data dating back to 2001 and are built off of a combination of basic team statistics (e.g., points, rebounds, assists, winning %, etc.), more advanced team statistics (e.g., defensive rating, free throw rate, true shooting %, etc.), Vegas odds, and game-specific variables (e.g., series game #). We use four separate models, each producing a different prediction. Here is an example of predictions from one 2016 NBA Finals game, and an example of how to interpret each number:
| Game | Vegas Spread | 284 Spread | Cover Prob | Vegas Total | 284 Total | Over Prob |
| GSW-CLE | -5.0 | -11 | 74% | 205 | 195 | 22% |
- 284 Spread -11 means we predict that the Warriors will win by 11 points
- Cover Prob 74% means we give the Warriors a 74% chance of covering the 5pt Vegas Spread. Numbers < 50% indicate the away team will cover the spread, numbers > 50% indicate the home team will cover the spread.
- 284 Total 195 means we predict a total of 195 points scored between the two teams
- Over Prob 22% means we give the game a 22% chance of going over the Vegas Total (205). Numbers < 50% favor the under, numbers > 50% favor the over.
One important note with these models is that they are generated separately, so they do not always agree with each other. For example, consider a game with a Vegas Total of 205, and our 284 Total is 195 (predicting the under). It is possible that our Over Prob for that game is 60% (predicting the over), as that model generates its prediction separately from the 284 Total model. We use multiple models to generate different views of the outcome – and when those views agree with each other, it creates more confidence in the predicted result.
Total Trends
The totals in NBA playoff games have moved up and down over the years. Since 1991, the average total points scored in an NBA playoff game is 192. Looking at more recent seasons, games from 2010-2016 averaged 195 points and games from 2013-2016 averaged 198 points (largely influenced by the Warriors). Staying focused on games since 2013, 75% of games fall between 185 and 210 points, with a mean of 198 and a median of 197.
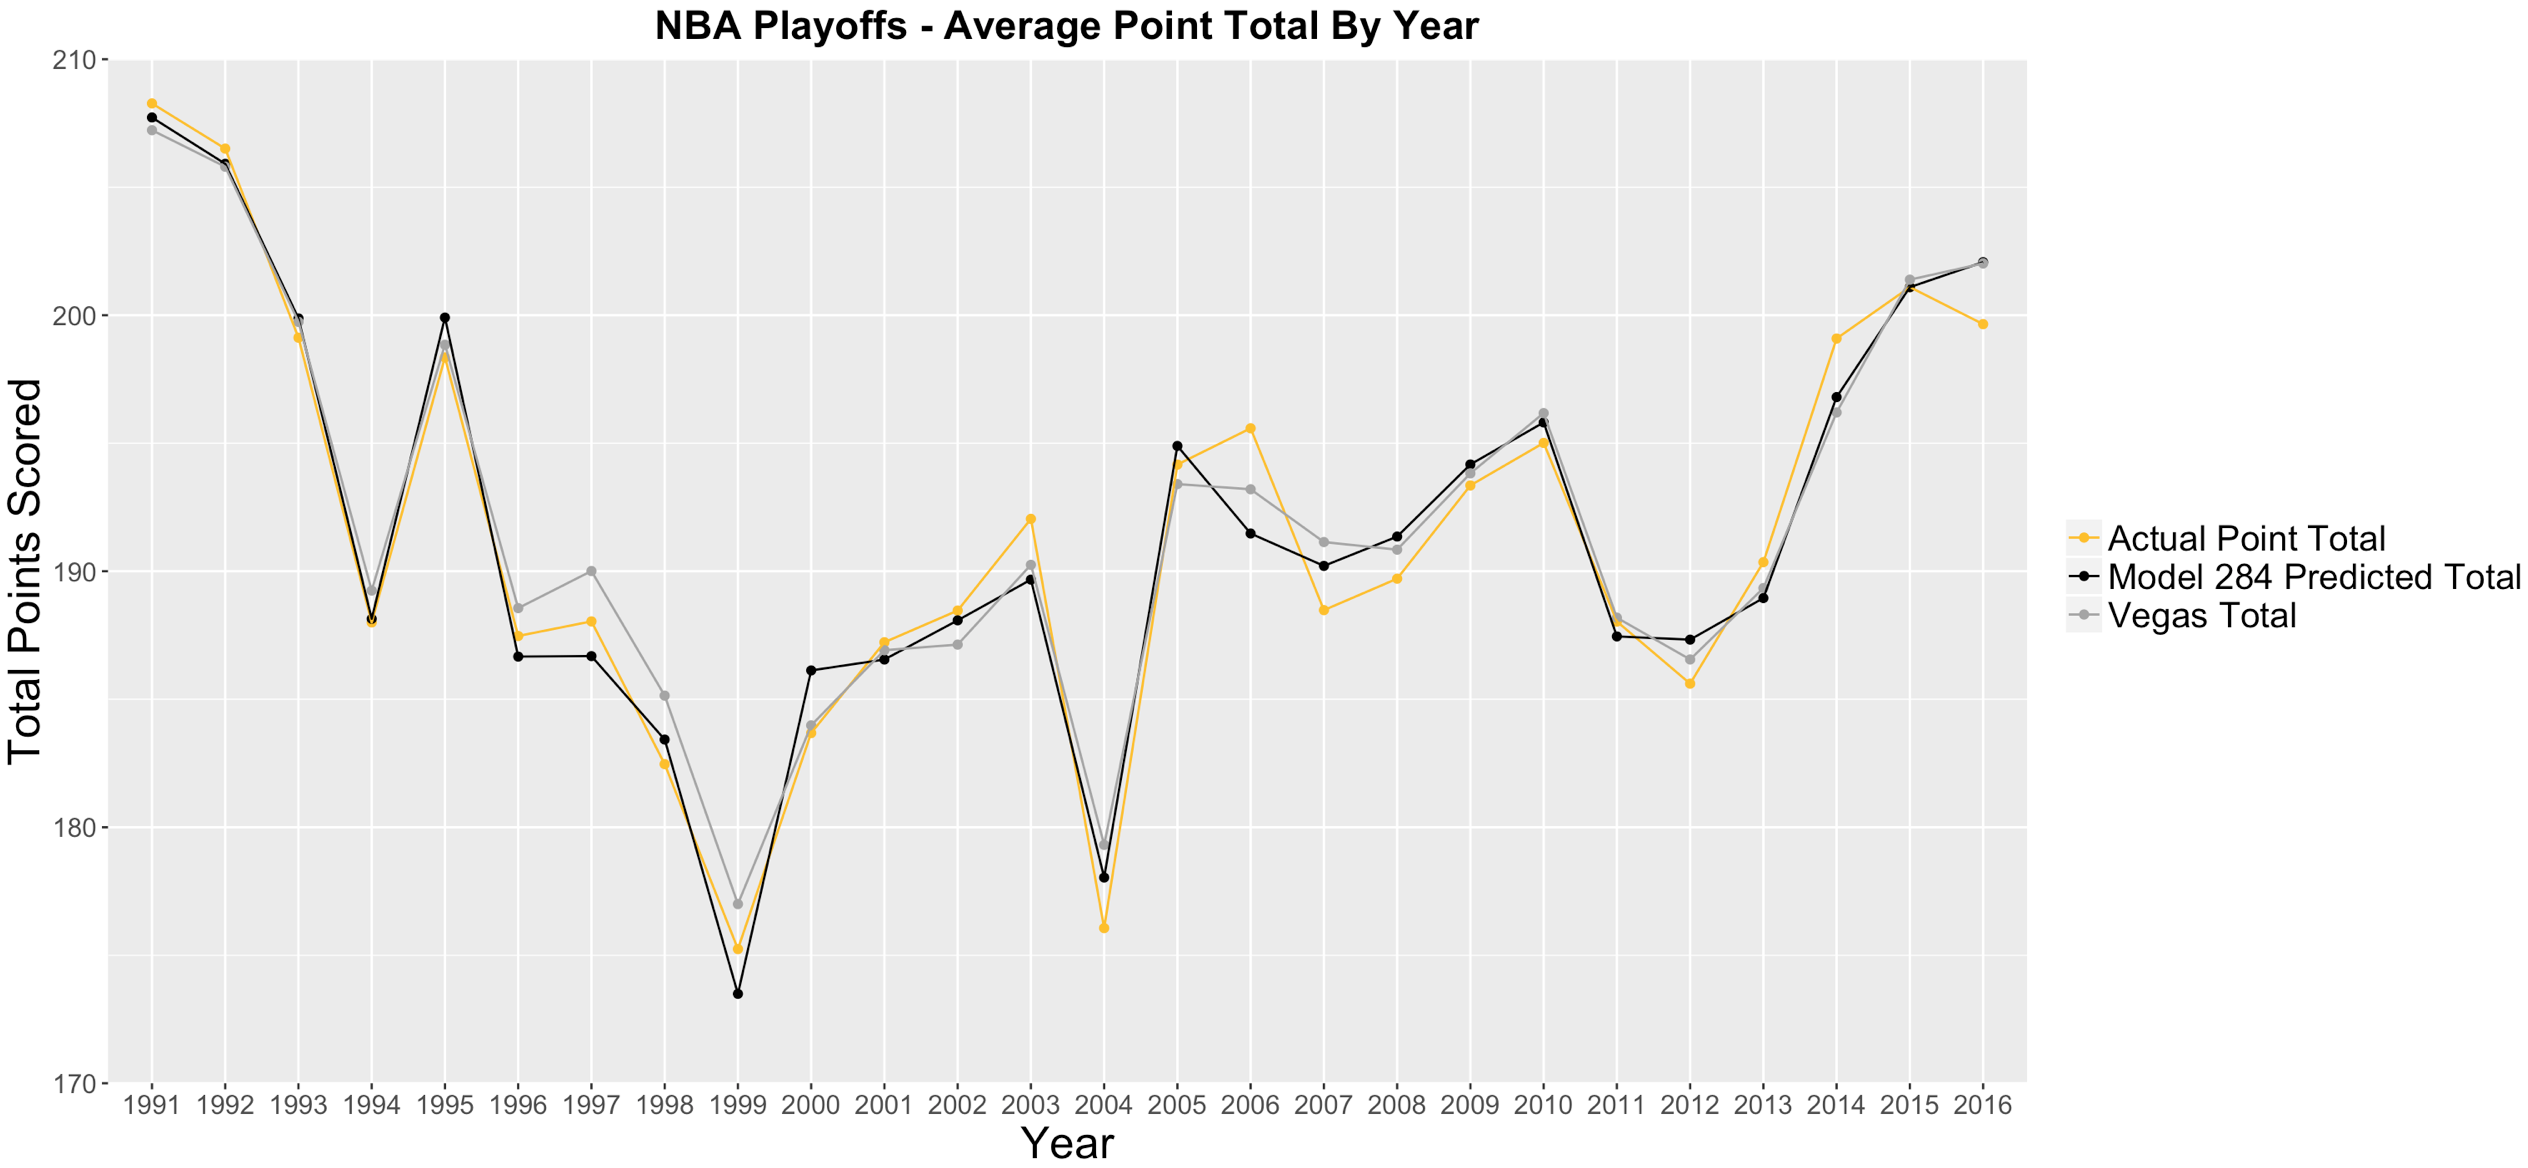
Vegas Totals in the above graph have trended tightly with the actual point totals over the years (good job, bookmakers). How have the overs/unders performed as these totals have shifted? Overall, the under has been the better bet in NBA Playoff games, with only 48.1% of games since 1991 going over the Vegas Total (and a similar 47.8% of games going over since 2013, despite the increase in scoring). In most cases, more money is being bet on overs (because fans don’t like cheering for a bunch of missed shots), thus it is not surprising to see more games falling under the Vegas total, as it is typically a more profitable outcome for the house (once again, good job, bookmakers). Since the NBA moved to the 7-7-7-7 format in 2003, here is how the total numbers look when split by series game number and playoff round:
| Gm | # of Gms | % of Gms that go Over | Avg Points Scored | Avg Vegas Total | Avg 284 Total |
| 1 | 210 | 50.5% | 192.5 | 192.6 | 192.4 |
| 2 | 210 | 50.0% | 193.1 | 192.7 | 192.4 |
| 3 | 210 | 46.2% | 191.3 | 192.8 | 192.6 |
| 4 | 210 | 47.1% | 193.3 | 192.5 | 192.3 |
| 5 | 174 | 48.3% | 193.0 | 192.4 | 192.0 |
| 6 | 123 | 43.1% | 189.4 | 190.8 | 191.1 |
| 7 | 44 | 38.6% | 187.1 | 189.6 | 190.3 |
| All | 1181 | 47.5% | 192.1 | 192.3 | 192.1 |
| Round | # of Gms | % of Gms that go Over | Avg Points Scored | Avg Vegas Total | Avg 284 Total |
| 1 | 618 | 46.9% | 192.3 | 192.4 | 192.7 |
| 2 | 321 | 51.7% | 192.9 | 192.6 | 191.9 |
| 3 | 160 | 46.3% | 192.6 | 192.9 | 192.6 |
| 4 | 82 | 37.8% | 186.3 | 189.4 | 188.2 |
| All | 1181 | 47.5% | 192.1 | 192.3 | 192.1 |
As our models are trained on the actual game results, our predictions also side with the under more frequently, with 47% of 284 Total predictions on the over, and 44% of our Over Prob predictions on the over. I go into more detail on the accuracy of our total predictions in the paragraphs below.
2017 Playoffs: Considering all 44 first round games in this year’s playoffs, the mean Vegas Total was 204.9, the mean actual total was 205.3, our mean predicted total was 204.1, and the over went 24-20 (54.5%).
Spread Trends
Relative to point totals, the average spread (or margin of victory) in NBA playoff games has seen less fluctuation over the years. Considering all games from 1991-2016, the mean margin of victory (mov) is -4.6 and the median is -5. If we look at 2013-2016, those figures shift slightly to a mean of -4.3 and a median of -4. Note that for all mov, Vegas Spread, and 284 Spread figures, negative values indicate a victory (or predicted victory) for the home team, and positive values indicate a victory for the road team. Since 1991, home teams have won 65% of playoff games, but have only covered the spread 49.8% of the time. Again filtering to 2013-2016, home teams continued to cover at a 49.9% clip, but their win percentage drops from 65% to 62%. While these changes are not extreme, reduced winning % and mov for home teams do indicate that the playoffs have been more competitive in recent years. This could be changing in 2016 and 2017 as we see the Warriors and Cavs ascend into a separate class (thanks for making this worse, KD).
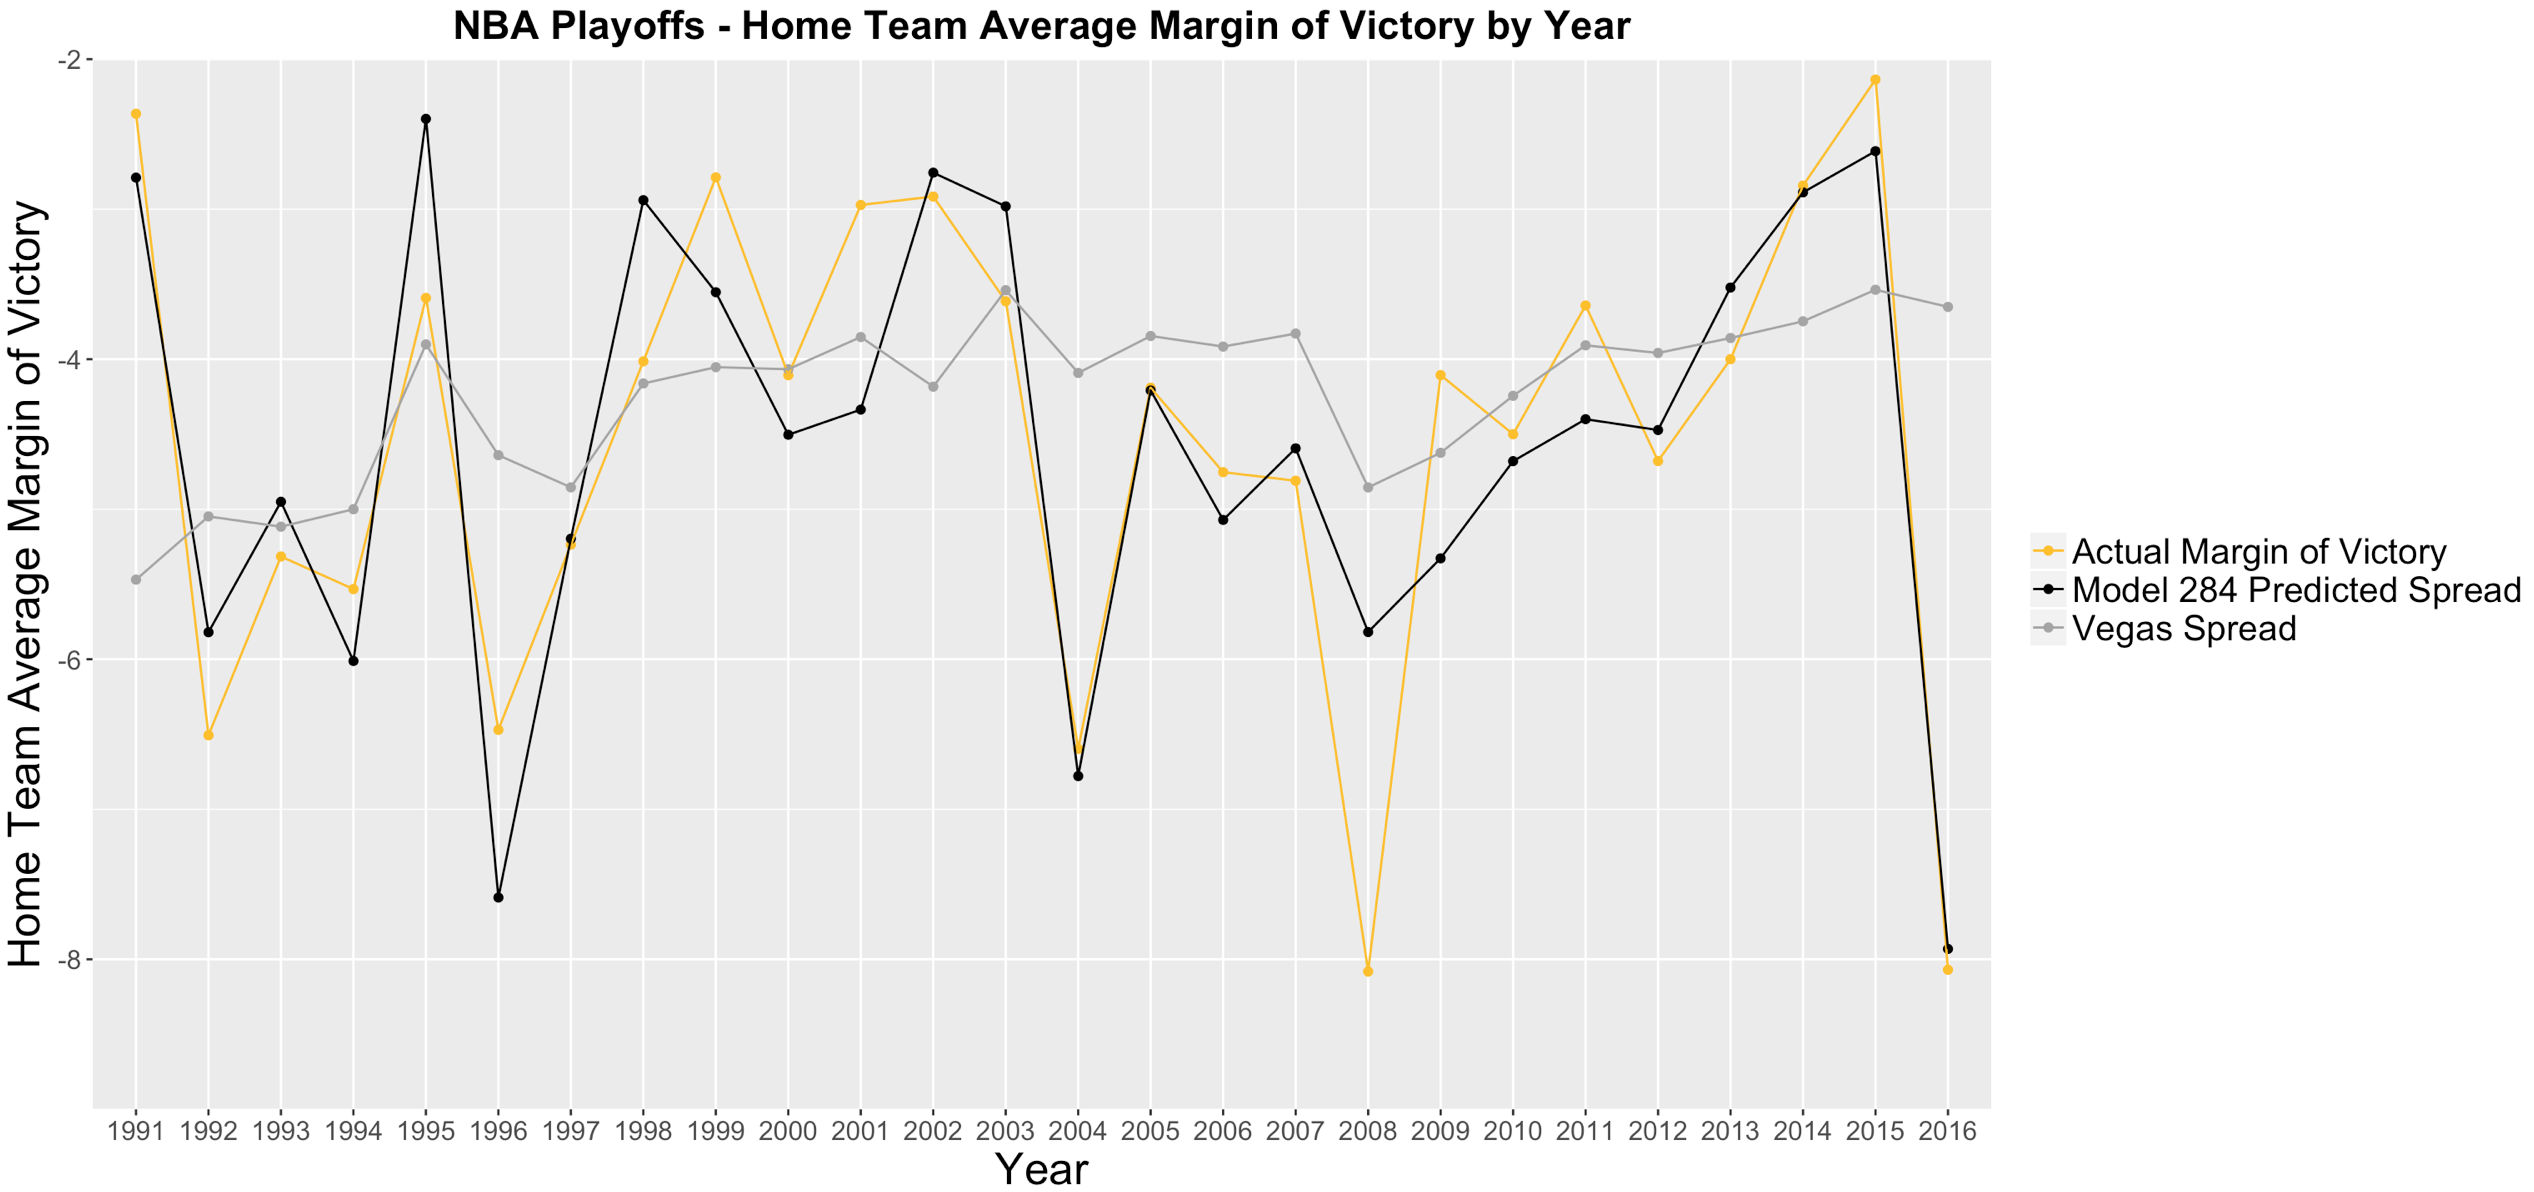
As far as our predicted spreads, there are some differences between our two models. The 284 Spread model has predicted the home team to cover 54% of the time on out-of-sample predictions, while our Cover Prob model has predicted the home team covering only 49% of the time. The following sections will get into the accuracy of these models against the spread (ATS). Since the NBA moved to the 7-7-7-7 format in 2003, here is how the spread numbers look when split by series game number and playoff round:
| Gm | # of Gms | Home Win % | Home Cover % | Avg MOV | Avg Vegas Spread | Avg 284 Spread |
| 1 | 210 | 71.9% | 53.3% | -7.5 | -6.9 | -8.6 |
| 2 | 210 | 76.2% | 52.4% | -8.3 | -6.7 | -6.8 |
| 3 | 210 | 56.2% | 52.4% | -1.9 | -1.1 | -1.7 |
| 4 | 210 | 53.8% | 51.9% | -0.9 | +0.2 | -0.2 |
| 5 | 174 | 77.0% | 49.4% | -7.4 | -6.5 | -7.4 |
| 6 | 123 | 48.0% | 43.1% | +0.2 | -2.1 | -2.2 |
| 7 | 44 | 77.3% | 63.6% | -9.5 | -5.8 | -7.0 |
| All | 1181 | 65.1% | 51.5% | -4.7 | -4.0 | -4.6 |
| Round | # of Gms | Home Win % | Home Cover % | Avg MOV | Avg Vegas Spread | Avg 284 Spread |
| 1 | 618 | 65.7% | 50.2% | -4.5 | -3.9 | -4.5 |
| 2 | 321 | 64.2% | 53.6% | -4.7 | -4.0 | -4.9 |
| 3 | 160 | 65.0% | 51.9% | -5.2 | -4.2 | -4.7 |
| 4 | 82 | 64.6% | 52.4% | -5.4 | -3.9 | -4.7 |
| All | 1181 | 65.1% | 51.5% | -4.7 | -4.0 | -4.6 |
2017 Playoffs: Considering all 44 first round games in this year’s playoffs, the mean home team mov was -2.3, the mean Vegas Spread was -3.8, our mean predicted 284 Spread was -5.6, and home teams went 34% ATS along with 54.5% straight-up.
Model Accuracy
In short, all of the models are beating the Vegas figures (i.e., > 50% against the spread). For context, if you are able to exceed 52-53% ATS in the long run, you are doing well enough to make a profit. Between the two spread models, the Cover Prob model has been more accurate (56.9% ATS) than the 284 Spread (54.4% ATS). The two total models are slightly better, both hitting above 57% ATS. Our totals have a slightly lower root mean squared error (17.17) than the Vegas Totals (17.25), which means that our predictions are closer to the actual result, on average. The table below displays each of the four model’s historical accuracy on out-of-sample predictions:
| Model | # Correct | # Incorrect | ATS % |
| 284 Spread | 1093 | 917 | 54.4% |
| Cover Prob | 1143 | 867 | 56.9% |
| 284 Total | 1176 | 881 | 57.2% |
| Over Prob | 1180 | 877 | 57.4% |
As far as “live” predictions, we have been using the models to make predictions for the 2017 playoffs as the games roll in. Here is how the models did in predicting all 44 first round games:
| 2017 NBA Playoffs – 1st Round Games | Model Accuracy | |||
| Model | # Correct | # Incorrect | ATS % |
| 284 Spread | 19 | 25 | 43.2% |
| Cover Prob | 29 | 15 | 65.9% |
| 284 Total | 24 | 20 | 54.5% |
| Over Prob | 23 | 21 | 52.3% |
Optimizing Model Accuracy
While we could use these predictions on every game, what about games where the 284 Spread has the home team covering, but the Cover Prob has the away team covering? Or, what if our 284 Total is only 0.1 points above the Vegas Total? Is there really any advantage to be had in those games? Looking at the data from previous years, we can optimize our accuracy by weeding out games with these types of conflicting predictions.
In general, the further away our predictions are from Vegas lines, the better they have performed. For spreads, if we apply the criteria of:
(1) our 284 Spread and Cover Prob agree on which team will cover,
(2) our Cover Prob is 70% or more, and
(3) our 284 Spread is at least 2 points different from the Vegas Spread,
our spread predictions have gone 65.9% ATS on out-of-sample predictions. An example of a game that would fit these criteria: the Warriors are favored by 5 points, we predict them to win by 8 points, and we predict an 83% chance that they cover. If we apply the same criteria to the totals, we get a similar result. For games that meet the following criteria:
(1) our 284 Total and Over Prob are on the same side of the total,
(2) our Over Prob is 70% or more (or, in the case of an under, 30% or less), and
(3) our 284 Total is at least 2 points different from the Vegas Total,
our predictions have gone 67.3% ATS on out-of-sample predictions. An example of a game that would fit these criteria: a game has a total of 210, we predict a total of 215, and we predict an 84% chance of the game going over. In summary, when applying these criteria to our predictions for all games in our dataset, here are the results:
| NBA Playoffs | Historical Accuracy on Games Meeting Criteria | |||
| Bet Type | # Correct | # Incorrect | ATS % |
| Spread Plays | 209 | 108 | 65.9% |
| Total Plays | 284 | 138 | 67.3% |
Applying these criteria to games in the 1st round of the 2017 NBA playoffs, we have been off to a hot start (6-0 on spread plays and 9-3 on total plays). Expect these to cool off a bit as the sample grows, but it is certainly good to see that the models seem to be working properly.
| 2017 NBA Playoffs – 1st Round Games Meeting Criteria | Model Accuracy | |||
| Bet Type | # Correct | # Incorrect | ATS % |
| Spread Plays | 6 | 0 | 100.0% |
| Total Plays | 9 | 3 | 75.0% |
Conclusion
While there will always be games that do not go according to plan, in a large enough sample, these trends, predictions, and optimizations should provide a great advantage in betting NBA Playoff games. If you are interested in seeing our predictions for the remaining playoff games this year, follow us on Twitter. If you are looking for more info on these models, predictions, or our data, feel free to reach out on Twitter or Facebook.
In case anyone is wondering, the Timberwolves are a league-worst 45.8% ATS since 2005, a trend that is due for some regression in 2017-18 when Towns averages 30-20-10 #InThibsWeTrust