The article below shows how our models view this year’s tournament field from a simulation perspective. Each table shows the % chance that each team advances to a given round of the tournament (e.g., in the first table, Alabama has an 88.1% chance of advancing to the 2nd round). See related posts for our Full 2023 Tournament Bracket and Game-by-Game Predictions.
Tournament simulations are an awesome tool to account for all the potential matchups that teams could face on their way to cutting down the nets. They are extremely useful for comparing “what is most likely to happen” against public picks to find optimal places to differentiate your bracket from others in your pool. They also do a great job of highlighting how difficult it is to make a run in this tournament – even the teams that are most likely to get to the Final Four usually have less than a 50% chance of doing so (i.e., it is more likely that they DO NOT make the Final Four).
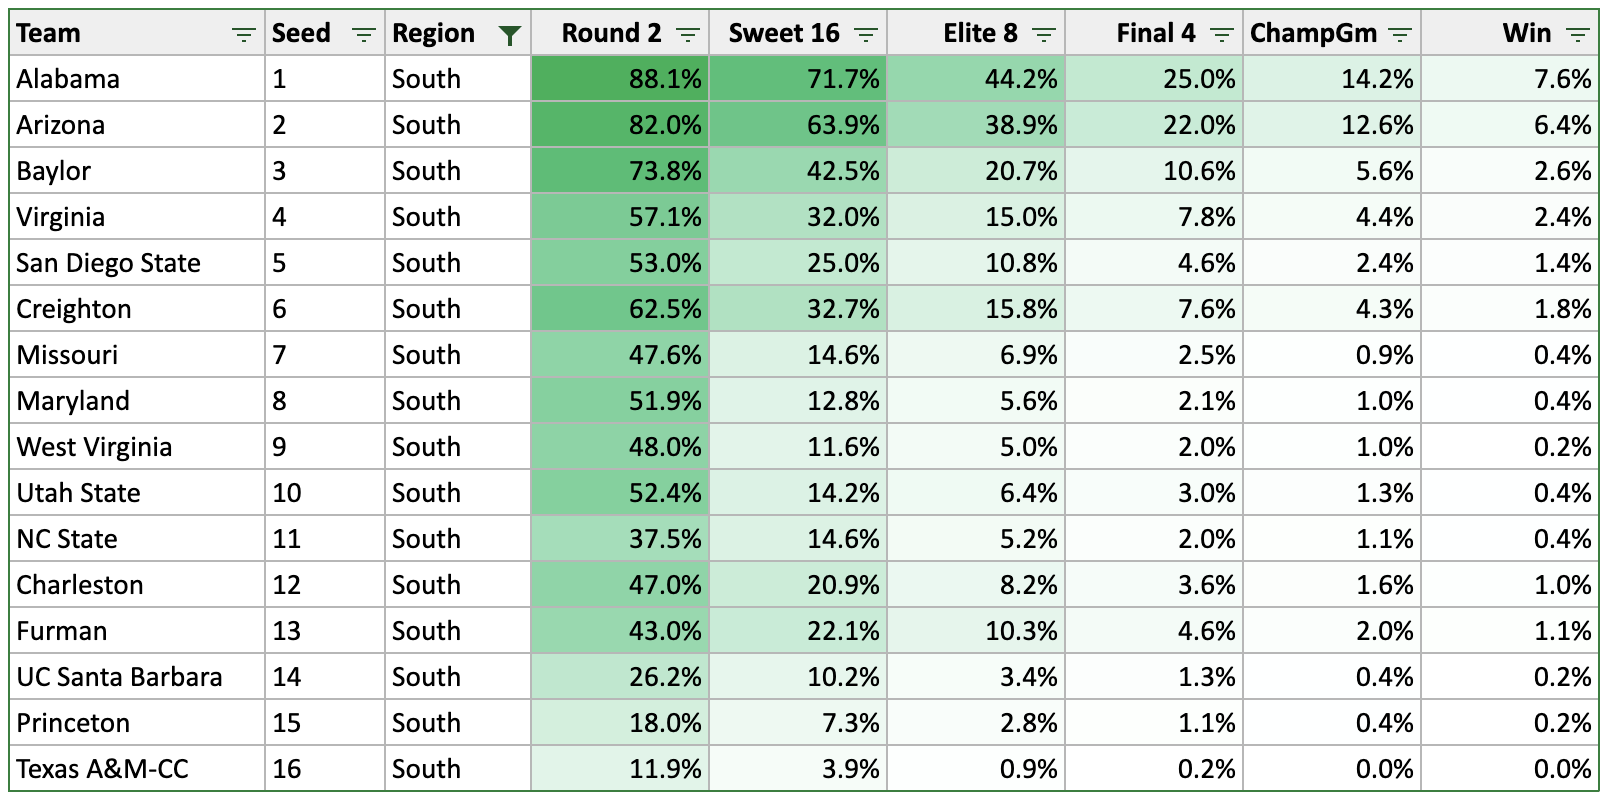
South Region
Top seeds Alabama (25% to make the Final Four) and Arizona (22%) both have relatively easy paths to the Elite 8 in this region, and our models would make their head-to-head matchup as roughly a toss-up should they eventually face off. With 37% of brackets on ESPN picking Alabama to reach the Final Four (and only 11% picking Arizona), our models like Arizona as a contrarian choice coming out of this region. Creighton (8%) has a tough 1st round matchup against NC State, but they are better than their seed would indicate (our rankings have them as the 13th-best team overall), and don’t be surprised if they knock off Baylor/Arizona in later rounds.
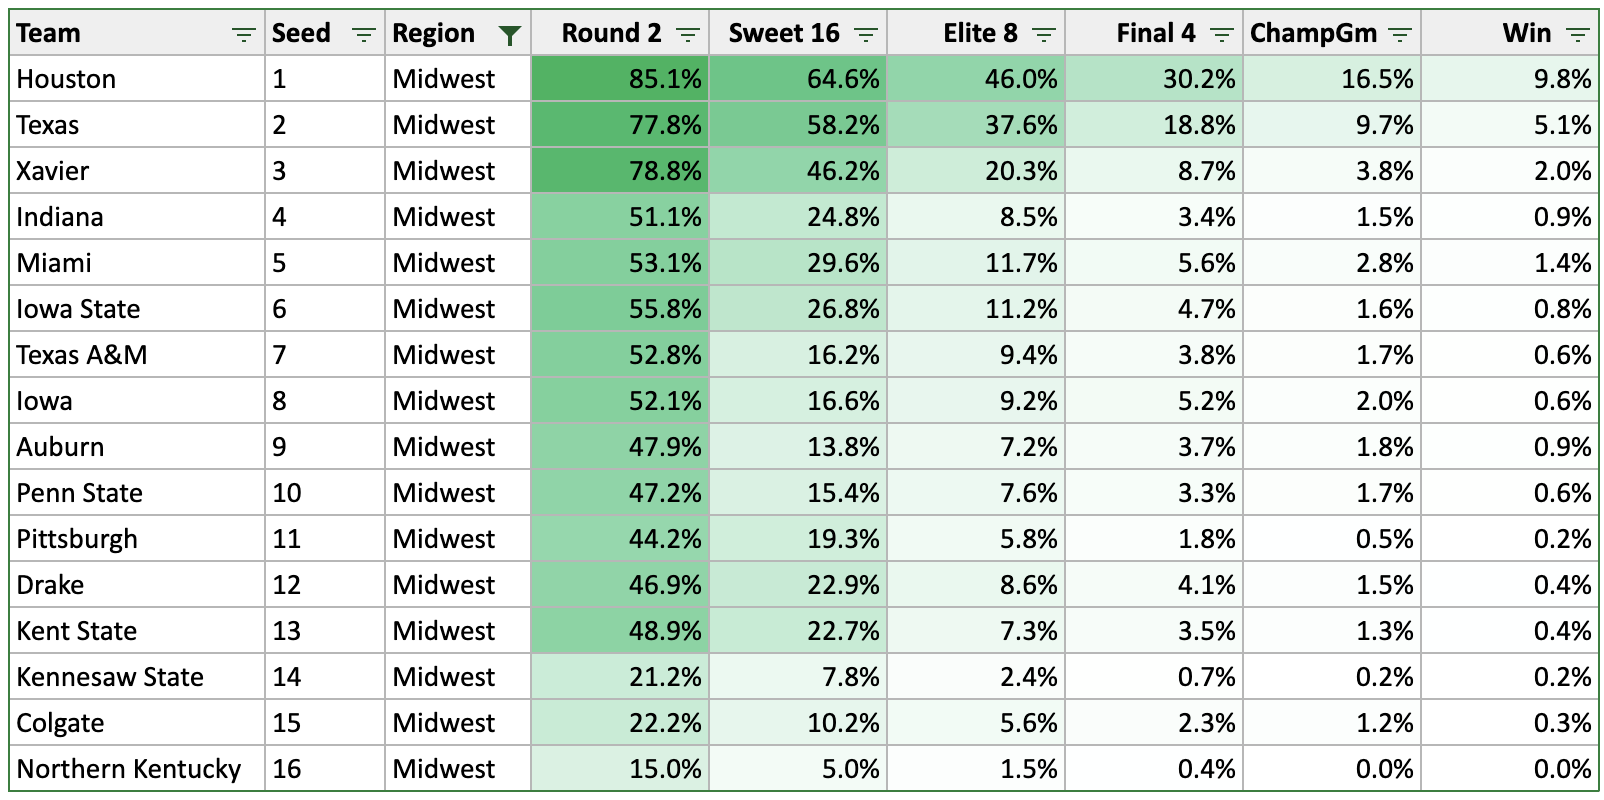
Midwest Region
This region also has the two top seeds standing out with Houston (30%) and Texas (19%) as overwhelming favorites to reach the Final Four. Note that Houston’s best player / Senior PG Marcus Sasser is nursing an injury – keep an eye on his status. Assuming full health for Sasser, we would give Houston a 61% win probability vs. Texas. However, while Houston is the most likely winner, the public is only picking Texas to go to the Final Four 13% of the time, so there is value in picking Texas > Houston in a large pool, especially if you believe Sasser’s injury will have an impact. 12-seed Drake and 13-seed Kent State have legit shots to win their first-round games, and that pod looks up for grabs. Iowa State will likely be just a slim favorite over whoever wins the play-in game (Pittsburgh or Mississippi State).
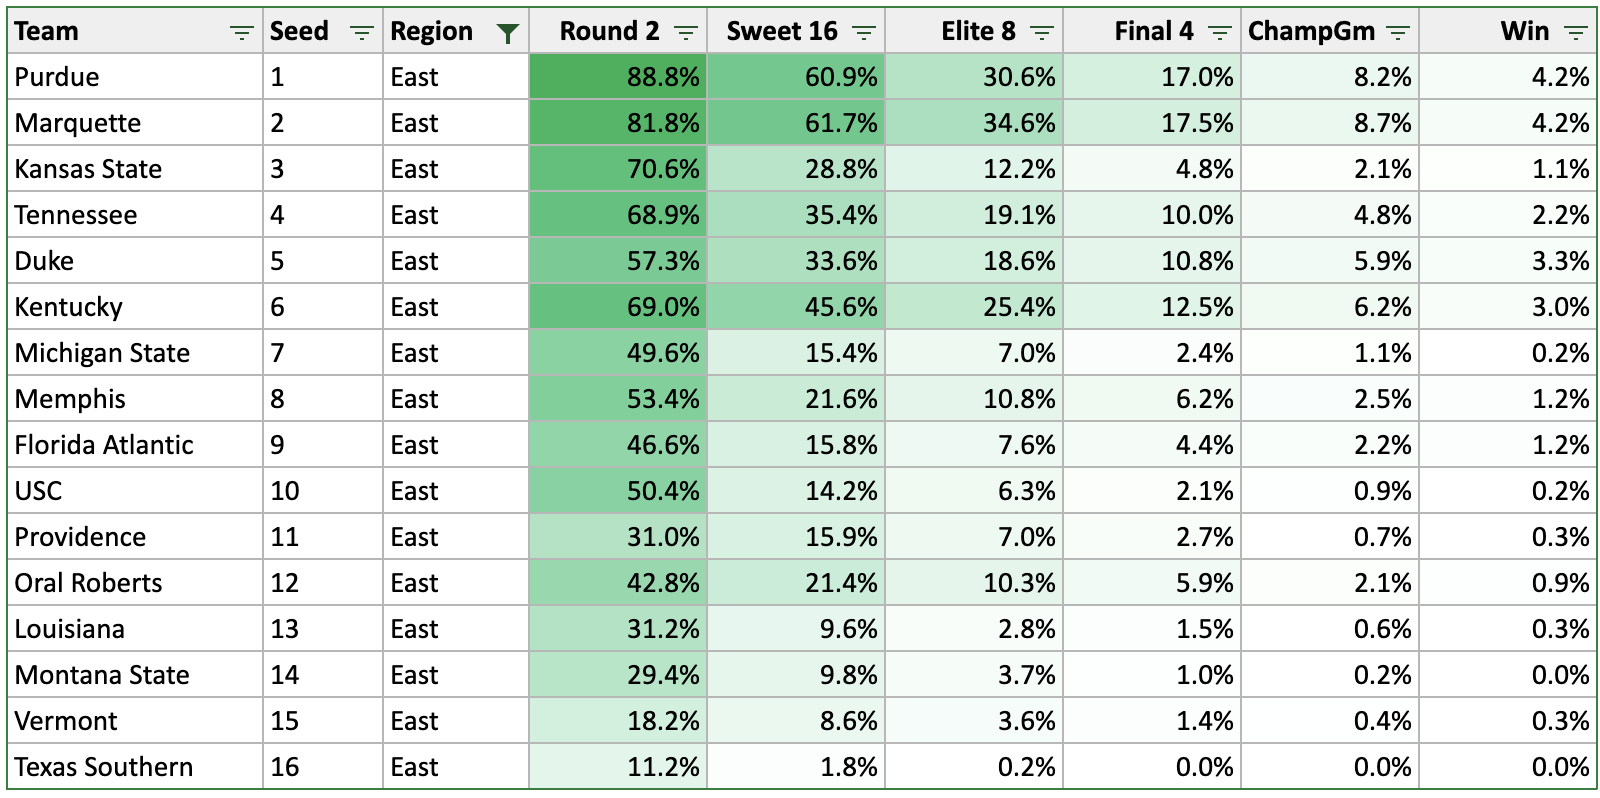
East Region
This region is wide open, as Purdue (17%) is the weakest 1-seed and they will face capable contenders in Marquette (18%), Tennessee (10%), Duke (11%), and Kentucky (13%). Even the 8/9 matchup winner will present a formidable opponent to Purdue. With 33% of ESPN brackets advancing Purdue to the Final Four, it seems an easy spot to pick another team to come out of the East region. In larger pools, Kentucky stands out as a good value relative to public perception (only being picked in the Final Four in 5% of brackets on ESPN), although their recent performance has not inspired much confidence!
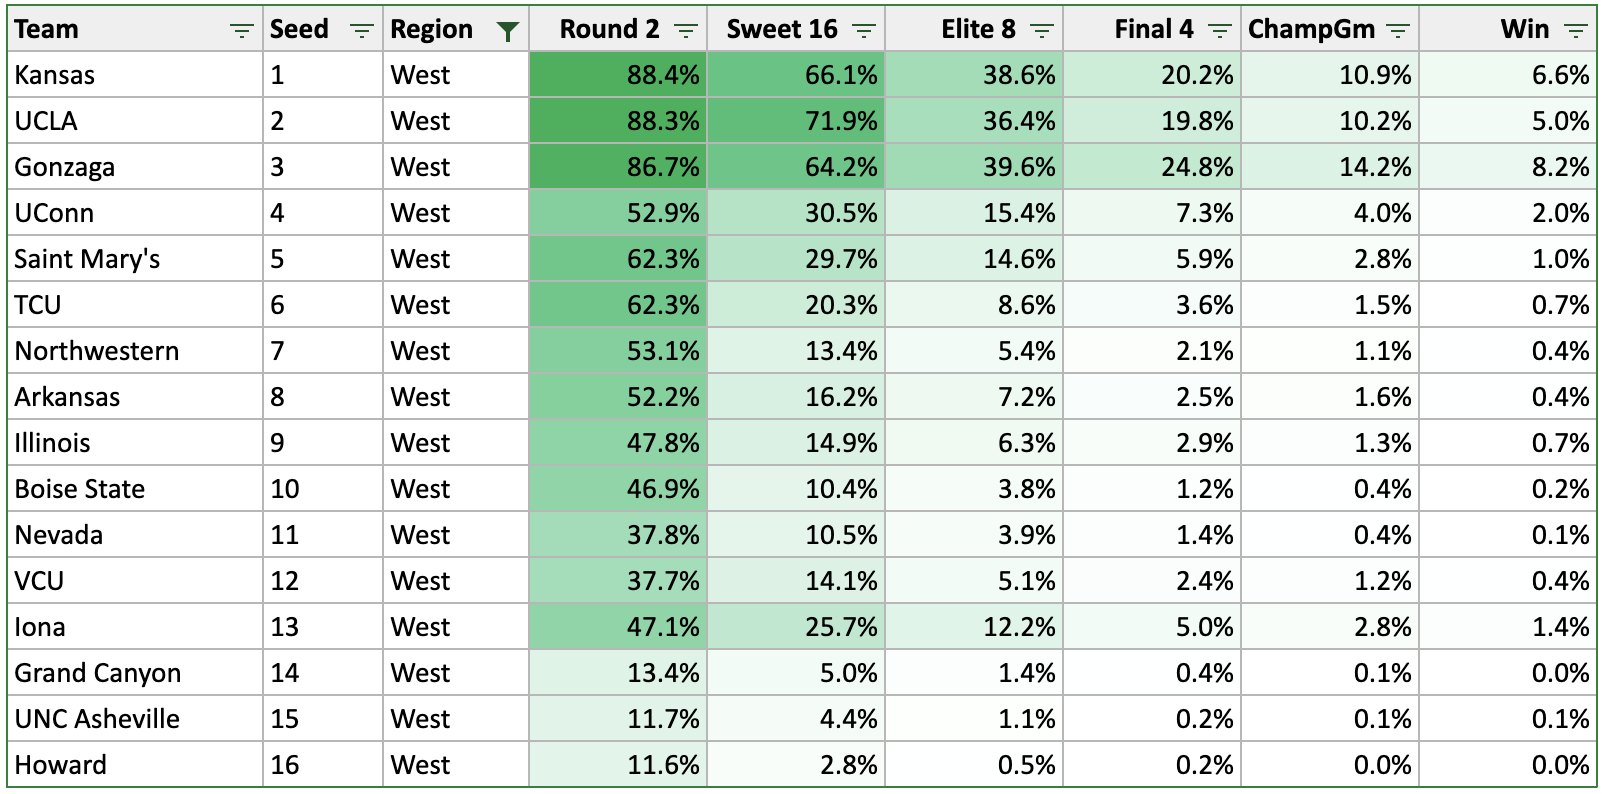
West Region
This is the toughest region, with all five of the top seeds ranking as top-10 teams overall in our metrics. Gonzaga (25%) has the best offense in the tournament and, if not for their potential Sweet 16 matchup with UCLA (20%), would stand out even more as the favorite to come out of this region. UCLA will be without one of their best players, Jaylen Clark, creating a subjective decision on how much that will impact their prospects of making a run. It certainly makes it easy to lean toward Gonzaga in a close matchup. On the top half of the bracket, UConn (7%) and Saint Mary’s (6%) are both serious contenders to knock off Kansas (21%), but it could be either team that makes it out of that pod to face Kansas, which eats away at their win probabilities in later rounds.
Tournament Champ
Our sim results are more balanced than many others, as we have a collection of teams bunched at the top of the list. For example, while Houston (9.8%) is our most likely champion, other projections have Houston in the 15-20% range. Gonzaga (8.2%) stands out relative to the 4.4% of ESPN brackets that are choosing the Zags to win it all. Alabama (7.6%) and Arizona (6.4%) are both solid choices, but their head-to-head matchup being 50/50 makes our numbers lower than most on Alabama. As other longshots, Marquette (4.2%) and Kentucky (3.0%) both show value compared to public bracket picks. Here is the full output of our simulation:
| Team | Seed | Quad | R2 | S16 | E8 | F4 | NCG | Win |
|---|---|---|---|---|---|---|---|---|
| Houston | 1 | Midwest | 0.851 | 0.646 | 0.46 | 0.302 | 0.165 | 0.098 |
| Gonzaga | 3 | West | 0.867 | 0.642 | 0.396 | 0.248 | 0.142 | 0.082 |
| Alabama | 1 | South | 0.881 | 0.717 | 0.442 | 0.25 | 0.142 | 0.076 |
| Kansas | 1 | West | 0.884 | 0.661 | 0.386 | 0.202 | 0.109 | 0.066 |
| Arizona | 2 | South | 0.82 | 0.639 | 0.389 | 0.22 | 0.126 | 0.064 |
| Texas | 2 | Midwest | 0.778 | 0.582 | 0.376 | 0.188 | 0.097 | 0.051 |
| UCLA | 2 | West | 0.883 | 0.719 | 0.364 | 0.198 | 0.102 | 0.05 |
| Marquette | 2 | East | 0.818 | 0.617 | 0.346 | 0.175 | 0.087 | 0.042 |
| Purdue | 1 | East | 0.888 | 0.609 | 0.306 | 0.17 | 0.082 | 0.042 |
| Duke | 5 | East | 0.573 | 0.336 | 0.186 | 0.108 | 0.059 | 0.033 |
| Kentucky | 6 | East | 0.69 | 0.456 | 0.254 | 0.125 | 0.062 | 0.03 |
| Baylor | 3 | South | 0.738 | 0.425 | 0.207 | 0.106 | 0.056 | 0.026 |
| Virginia | 4 | South | 0.571 | 0.32 | 0.15 | 0.078 | 0.044 | 0.024 |
| Tennessee | 4 | East | 0.689 | 0.354 | 0.191 | 0.1 | 0.048 | 0.022 |
| Xavier | 3 | Midwest | 0.788 | 0.462 | 0.203 | 0.087 | 0.038 | 0.02 |
| UConn | 4 | West | 0.529 | 0.305 | 0.154 | 0.073 | 0.04 | 0.02 |
| Creighton | 6 | South | 0.625 | 0.327 | 0.158 | 0.076 | 0.043 | 0.018 |
| Iona | 13 | West | 0.471 | 0.257 | 0.122 | 0.05 | 0.028 | 0.014 |
| Miami | 5 | Midwest | 0.531 | 0.296 | 0.117 | 0.056 | 0.028 | 0.014 |
| San Diego State | 5 | South | 0.53 | 0.25 | 0.108 | 0.046 | 0.024 | 0.014 |
| Memphis | 8 | East | 0.534 | 0.216 | 0.108 | 0.062 | 0.025 | 0.012 |
| Florida Atlantic | 9 | East | 0.466 | 0.158 | 0.076 | 0.044 | 0.022 | 0.012 |
| Kansas State | 3 | East | 0.706 | 0.288 | 0.122 | 0.048 | 0.021 | 0.011 |
| Furman | 13 | South | 0.43 | 0.221 | 0.103 | 0.046 | 0.02 | 0.011 |
| Saint Mary's | 5 | West | 0.623 | 0.297 | 0.146 | 0.059 | 0.028 | 0.01 |
| Charleston | 12 | South | 0.47 | 0.209 | 0.082 | 0.036 | 0.016 | 0.01 |
| Auburn | 9 | Midwest | 0.479 | 0.138 | 0.072 | 0.037 | 0.018 | 0.009 |
| Oral Roberts | 12 | East | 0.428 | 0.214 | 0.103 | 0.059 | 0.021 | 0.009 |
| Indiana | 4 | Midwest | 0.511 | 0.248 | 0.085 | 0.034 | 0.015 | 0.009 |
| Iowa State | 6 | Midwest | 0.558 | 0.268 | 0.112 | 0.047 | 0.016 | 0.008 |
| TCU | 6 | West | 0.623 | 0.203 | 0.086 | 0.036 | 0.015 | 0.007 |
| Illinois | 9 | West | 0.478 | 0.149 | 0.063 | 0.029 | 0.013 | 0.007 |
| Iowa | 8 | Midwest | 0.521 | 0.166 | 0.092 | 0.052 | 0.02 | 0.006 |
| Texas A&M | 7 | Midwest | 0.528 | 0.162 | 0.094 | 0.038 | 0.017 | 0.006 |
| Penn State | 10 | Midwest | 0.472 | 0.154 | 0.076 | 0.033 | 0.017 | 0.006 |
| Drake | 12 | Midwest | 0.469 | 0.229 | 0.086 | 0.041 | 0.015 | 0.004 |
| Kent State | 13 | Midwest | 0.489 | 0.227 | 0.073 | 0.035 | 0.013 | 0.004 |
| Northwestern | 7 | West | 0.531 | 0.134 | 0.054 | 0.021 | 0.011 | 0.004 |
| Arkansas | 8 | West | 0.522 | 0.162 | 0.072 | 0.025 | 0.016 | 0.004 |
| NC State | 11 | South | 0.375 | 0.146 | 0.052 | 0.02 | 0.011 | 0.004 |
| Missouri | 7 | South | 0.476 | 0.146 | 0.069 | 0.025 | 0.009 | 0.004 |
| Utah State | 10 | South | 0.524 | 0.142 | 0.064 | 0.03 | 0.013 | 0.004 |
| VCU | 12 | West | 0.377 | 0.141 | 0.051 | 0.024 | 0.012 | 0.004 |
| Maryland | 8 | South | 0.519 | 0.128 | 0.056 | 0.021 | 0.01 | 0.004 |
| Colgate | 15 | Midwest | 0.222 | 0.102 | 0.056 | 0.023 | 0.012 | 0.003 |
| Providence | 11 | East | 0.31 | 0.159 | 0.07 | 0.027 | 0.007 | 0.003 |
| Louisiana | 13 | East | 0.312 | 0.096 | 0.028 | 0.015 | 0.006 | 0.003 |
| Vermont | 15 | East | 0.182 | 0.086 | 0.036 | 0.014 | 0.004 | 0.003 |
| West Virginia | 9 | South | 0.48 | 0.116 | 0.05 | 0.02 | 0.01 | 0.002 |
| USC | 10 | East | 0.504 | 0.142 | 0.063 | 0.021 | 0.009 | 0.002 |
| Michigan State | 7 | East | 0.496 | 0.154 | 0.07 | 0.024 | 0.011 | 0.002 |
| Pittsburgh | 11 | Midwest | 0.442 | 0.193 | 0.058 | 0.018 | 0.005 | 0.002 |
| UC Santa Barbara | 14 | South | 0.262 | 0.102 | 0.034 | 0.013 | 0.004 | 0.002 |
| Boise State | 10 | West | 0.469 | 0.104 | 0.038 | 0.012 | 0.004 | 0.002 |
| Princeton | 15 | South | 0.18 | 0.073 | 0.028 | 0.011 | 0.004 | 0.002 |
| Kennesaw State | 14 | Midwest | 0.212 | 0.078 | 0.024 | 0.007 | 0.002 | 0.002 |
| Nevada | 11 | West | 0.378 | 0.105 | 0.039 | 0.014 | 0.004 | 0.001 |
| UNC Asheville | 15 | West | 0.117 | 0.044 | 0.011 | 0.002 | 0.001 | 0.001 |
| Texas A&M-CC | 16 | South | 0.119 | 0.039 | 0.009 | 0.002 | 0 | 0 |
| Montana State | 14 | East | 0.294 | 0.098 | 0.037 | 0.01 | 0.002 | 0 |
| Grand Canyon | 14 | West | 0.134 | 0.05 | 0.014 | 0.004 | 0.001 | 0 |
| Northern Kentucky | 16 | Midwest | 0.15 | 0.05 | 0.015 | 0.004 | 0 | 0 |
| Howard | 16 | West | 0.116 | 0.028 | 0.005 | 0.002 | 0 | 0 |
| Texas Southern | 16 | East | 0.112 | 0.018 | 0.002 | 0 | 0 | 0 |