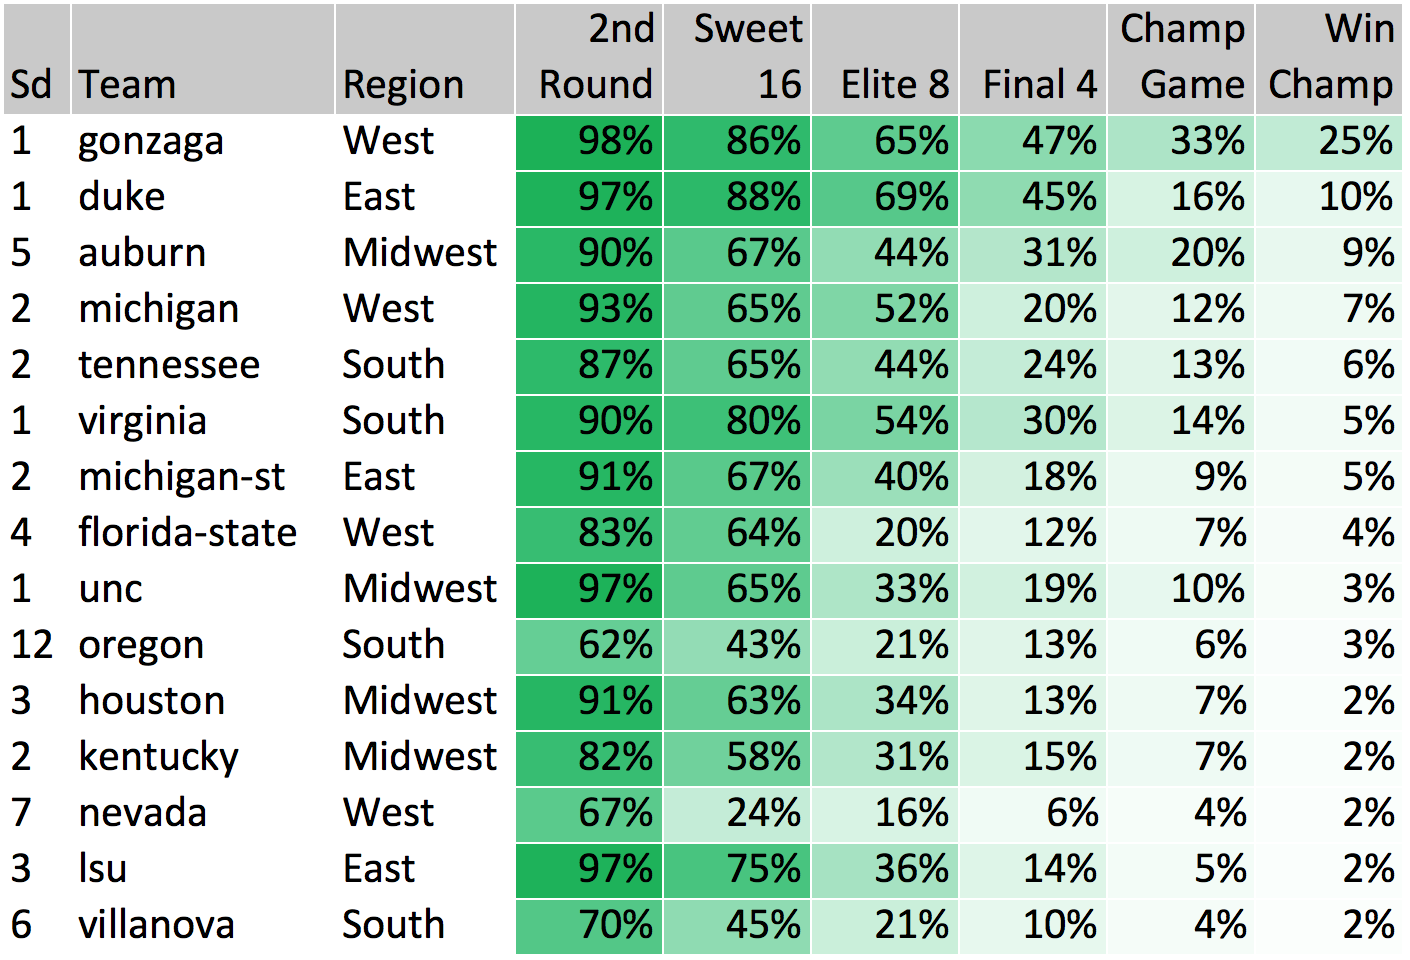
The article below shows how our models view this year’s tournament field from a simulation perspective. Each table shows the % chance that each team advances to a given round of the tournament (e.g., in the first table, Duke has a 97% chance of advancing to the 2nd round). These figures are calculated based on 60,000 simulations1 of this year’s tournament, which were performed using win probability predictions from our models. Note that play-in game teams are subject to change and are denoted with an *.
Tournament simulations are an awesome tool that can be used to account for all the potential matchups that teams could face on their way to cutting down the nets. They are extremely useful for comparing “what is most likely to happen” against public picks to find optimal places to differentiate your bracket from others in your pool. They also do a great job of highlighting how difficult it is to make a run in this tournament – even the teams that are most likely to get to the Final Four have less than a 50% chance of doing so (i.e., it is more likely that they do not make the Final Four)!
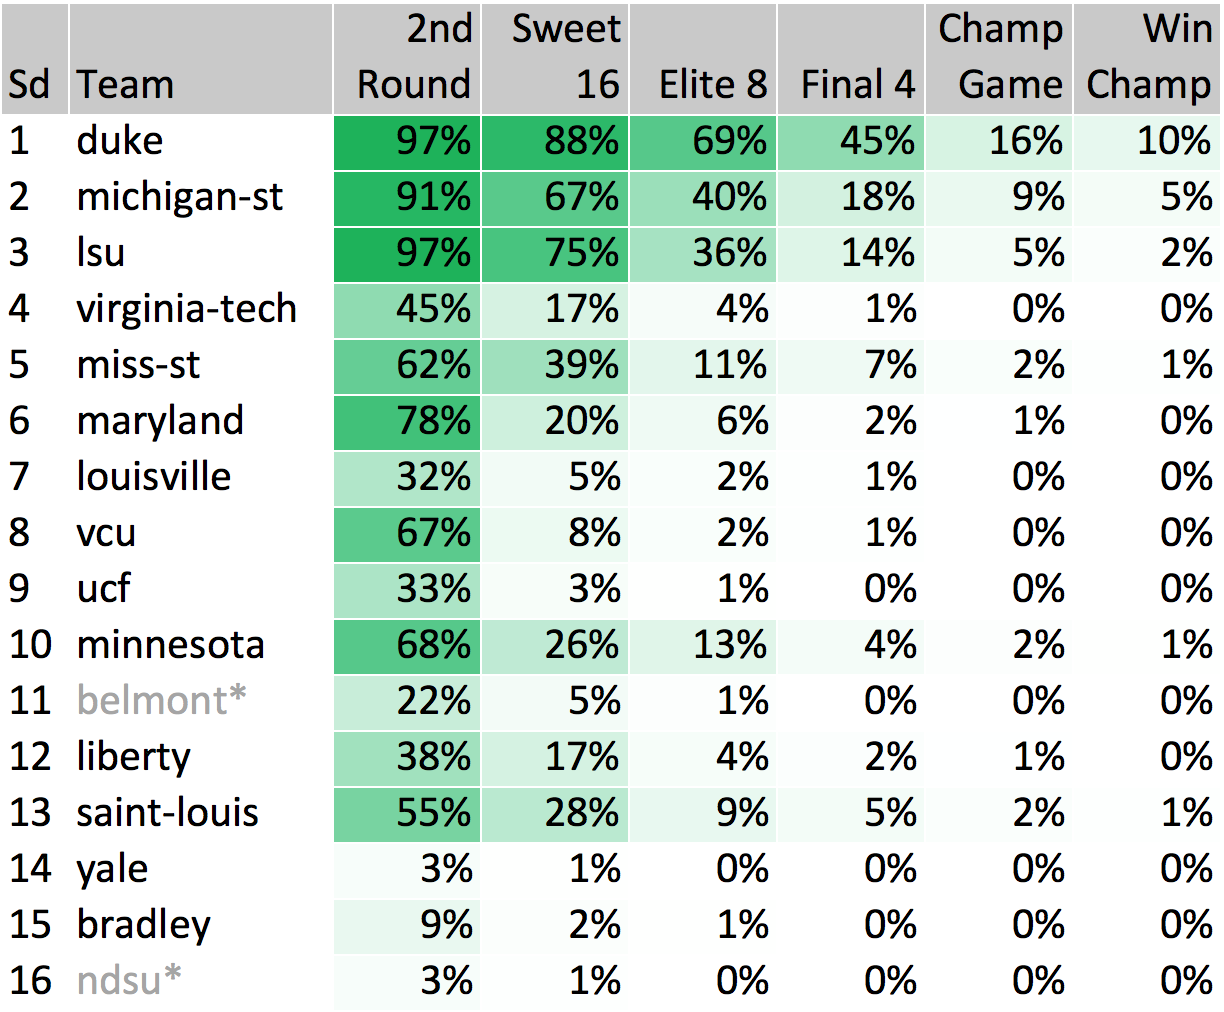
East Region
No surprise here, but Duke (45%) is the most likely team to come out of the East region, followed not so closely by Michigan State (18%) and LSU (14%). Our models are higher than others I have seen on LSU, but would still lean in favor of Michigan State if they were to meet up. Two first round upsets our models like are Minnesota (68%) > Louisville and St. Louis (55%) > Virginia Tech, both teams being bolstered by their success in conference tournaments.
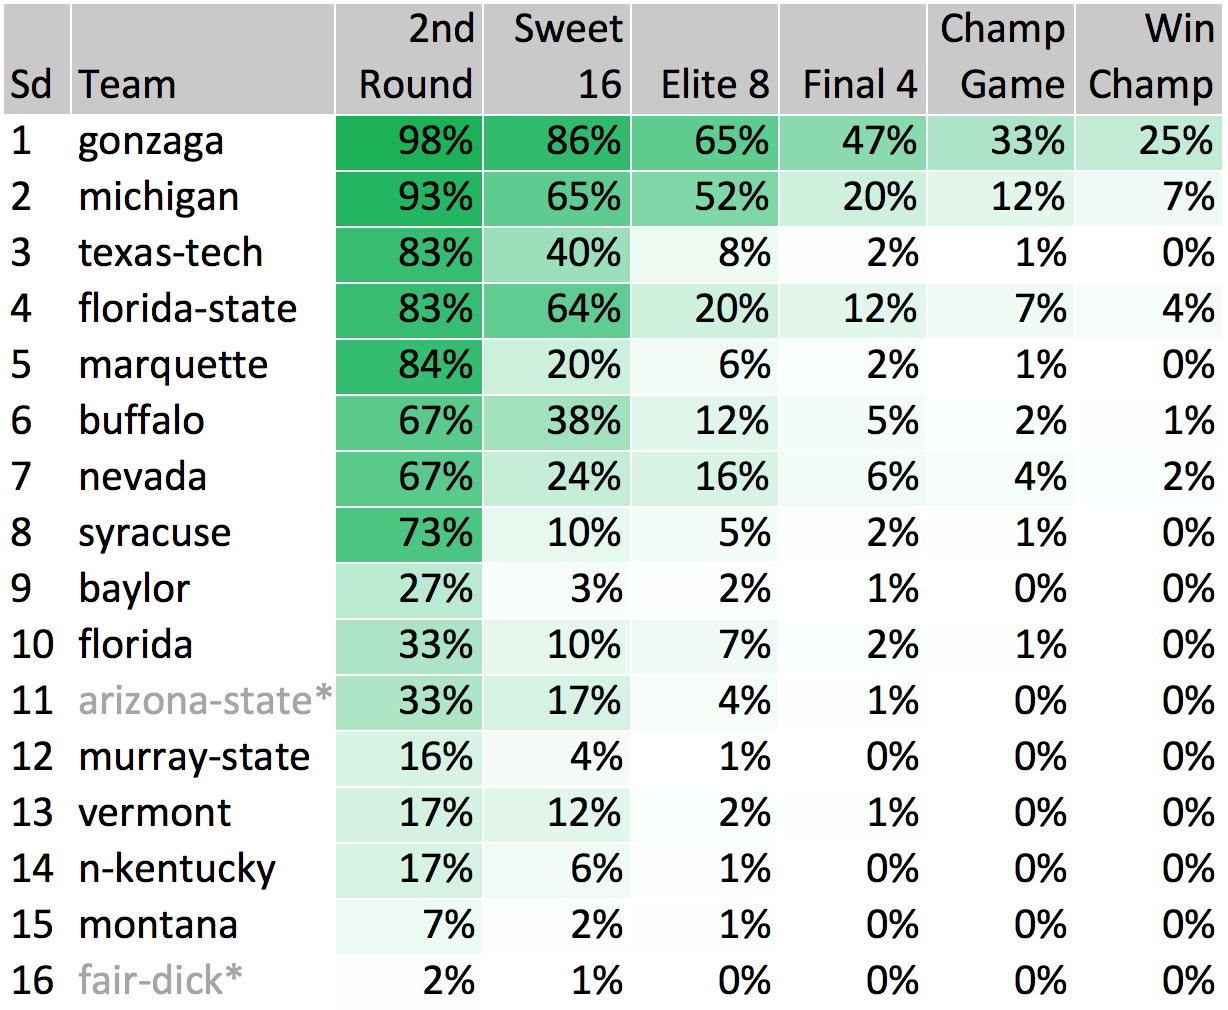
West Region
Another big favorite here with Gonzaga (47%) being the most likely Final Four representative from the West. Our numbers in this region are very chalky, aside from potentially Buffalo and/or Nevada making a multiple-game run, but it is most likely that Michigan would end that run if it happens.
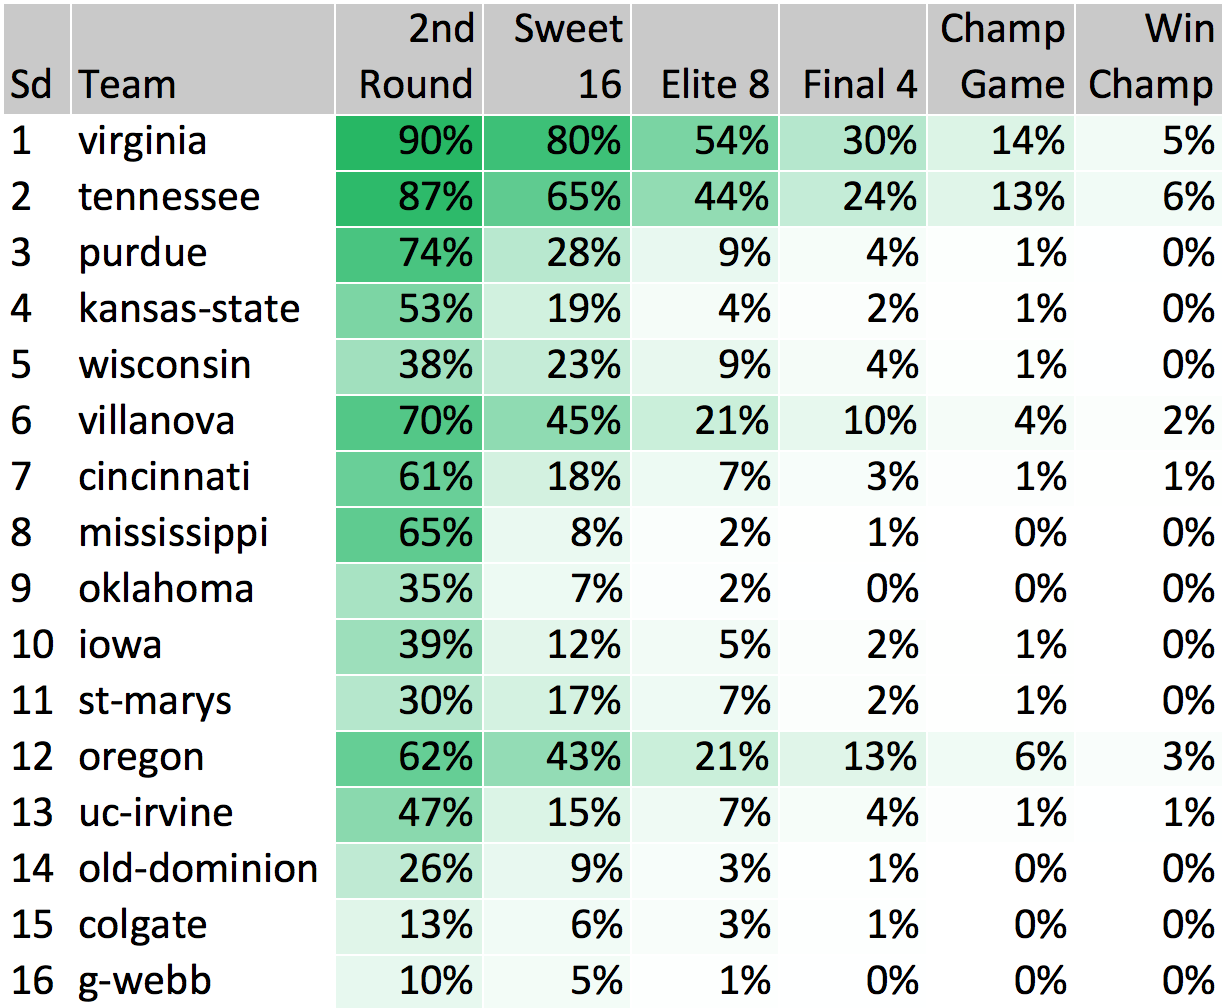
South Region
We see some potential parity in the South Region, with Virginia (30%) and Tennessee (24%) both in the same ballpark for a Final Four berth. There’s not much love for the other top seeds (Purdue, Kansas State, Wisconsin), while Villanova (10%) and Oregon (13%) both stand out as potential bracket busters (again we see two teams that are red hot coming off conference tournament wins).
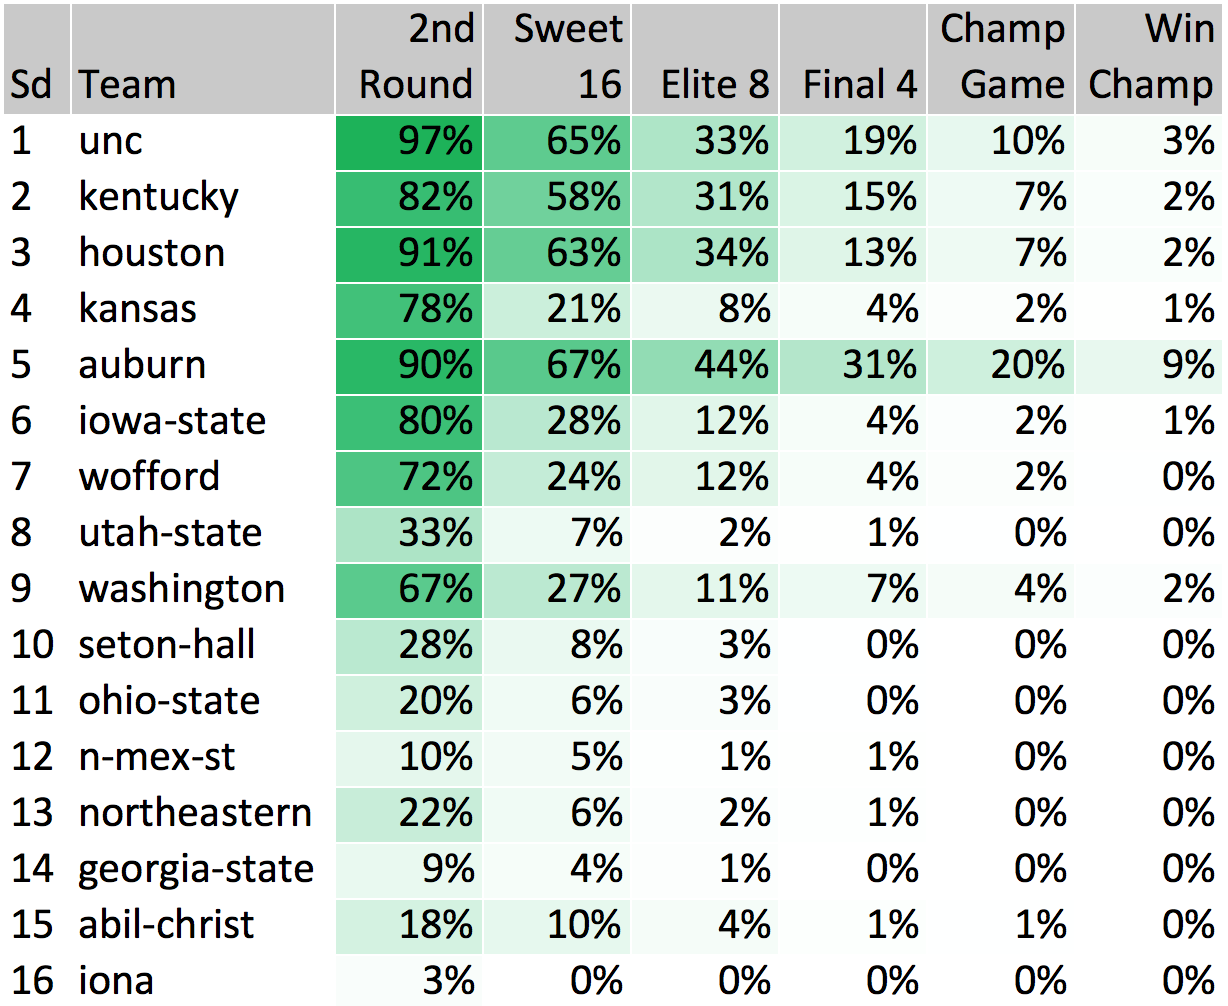
Midwest Region
The Midwest is easily the most interesting region as far as our models are concerned – we have Auburn (31%) as the most likely Final Four team, ahead of top seeds and much more popular choices North Carolina (19%), Kentucky (15%), and Houston (13%). Our models are higher on Auburn than both public consensus and other analytical models are. Some reasons our models like Auburn: very efficient offense, extremely high 3-point attempt rate (49%), won SEC conference tournament, high pre-season rank (#11), and great at forcing turnovers. Hopefully they keep on rolling!
Tournament Champ
Our numbers see Gonzaga (25%) and Duke (10%) as the two most likely champions. The current betting market odds have Duke (~31%) as the favorite to win it all, so our models are underweight on the Blue Devils. Maybe we need to add a ZION WILLIAMSON variable to our data… I’m guessing about 50% of brackets will have Duke winning, so picking a champion other than Duke is a great place to start in terms of diversifying your bracket from the rest of your pool. Here are the teams with the highest probability of winning the tournament:
1This simulation is compiled of 10,000 tournament simulation for each of our 6 probabilistic models (60,000 tournaments in total). For each simulation of the tournament, random numbers were generated for each game and compared with the given model’s win probability for that game (advancing either Team1 or Team2 depending on where the random number fell). For example, consider tournament #1, model #1, and game #1. For this game, model #1’s win probability for Team1 is 90%. A random number between 0 and 1 is generated – if the number generated is greater than 0.90, we advance Team2 to the next round, and if it is 0.90 or less, we advance Team1 to the next round. This process is repeated for each game until there is a tournament champion. Then, the process of simulating the tournament is repeated 9,999 more times (this is done for each model). Each model’s predictions have equal weighting in the results.