The article below discusses how our models view this year’s tournament field, and which teams are most likely to make a deep run. This is done in context of 60,000 simulations1 of this year’s tournament, which were performed using win probability predictions from our models. That simulation ultimately provides probabilities of each team advancing to the Sweet 16, Final Four, etc. Note that play-in game teams are subject to change.
Tournament simulations are an awesome tool to help account for all the potential matchups that teams could face on their way to cutting down the nets. They also do a great job of highlighting how difficult it is to come out on top – even the teams that are most likely to get to the Final Four have less than a 50% chance of doing so. With that said, you still need to fill out the bracket, so hopefully these probabilities help identify some smart picks to use.
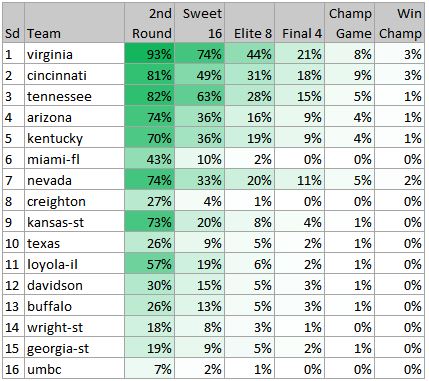
South Region
This region is the least clear in terms of a Final Four choice, with Virginia, Cincinnati, and Tennessee all having a decent shot to make it there. Though we do have Virginia as the slight favorite (21%), our numbers see it as much less likely than other odds you will see. Our model sees the intriguing Arizona-Kentucky matchup as a toss-up and would make Virginia a slight favorite over either team. Nevada is a potential dark horse here, as we have several models that favor them over Cincinnati and/or Tennessee if they can get by Texas in the first-round. Side note – if Virginia-Cincy do end up playing, I think the final score might be 20-19.
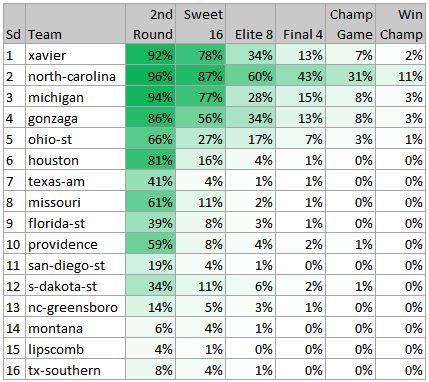
West Region
Out West, the top four seeds are a cut above everyone else. We make North Carolina a heavy favorite (43%) to get back to their 3rd straight Final Four. This is partly because Xavier and Gonzaga will have to battle it out on the top half of the bracket, which is driving down both of their Elite Eight probabilities and beyond. We make North Carolina roughly a 65% favorite over Michigan.
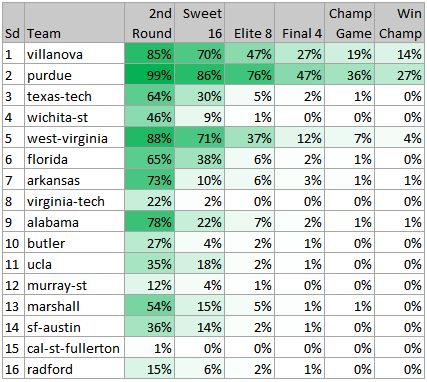
East Region
It is all about Purdue and Villanova here. By our numbers, the winner of this potential matchup would be the favorite to win it all (too bad they have to be in the same region!). So if this matchup does happen, they will likely cancel the rest of the tournament and crown the winner as champion – plan accordingly. Purdue is aided by the fact that they have an easier path to the Elite Eight than Villanova does (Nova would have to go through West Virginia, whom our models like quite a bit). And apparently our numbers give Marshall a good shot to knock off Wichita State in the game with the highest Total of the first round (166).
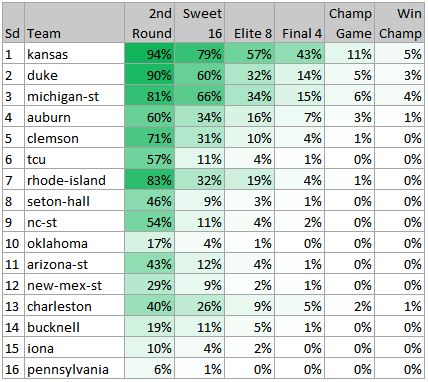
Midwest Region
In this region we see Kansas as having an “easy” path on the top half of the bracket that aids their probability (43% to reach Final Four). Duke, Michigan State, and even Rhode Island (sorry Trae Young) are beating up on each other in the bottom of this region and driving down their probabilities to reach later rounds. The 4-5-12-13 pod of this bracket is an absolute mess – good luck predicting who is coming out of there because honestly, I have no idea. Let’s hope it is Charleston.
Tournament Champ
Our numbers see Purdue (27%), Villanova, (14%), and North Carolina (11%) as the top tier of most likely to win it all, with Kansas (5%), West Virginia (4%), Michigan State (4%), Michigan (3%), Cincinnati (3%), Gonzaga (3%), and Virginia (3%) rounding out the top ten. Lastly, Cal State Fullerton did win it all on 3 out of 60,000 simulations (0.005%) so make sure to take a long hard look at them before you pencil in Purdue to the second round.
| Rank Champ | Rank Final4 | Team | Sd | Region | 2nd Rnd | Sweet 16 | Elite 8 | Final 4 | Champ Game | Win Champ |
|---|---|---|---|---|---|---|---|---|---|---|
| 1 | 1 | purdue | 2 | East | 98.6 | 85.6 | 75.8 | 47.1 | 36.0 | 26.9 |
| 2 | 4 | villanova | 1 | East | 85.5 | 70.1 | 46.5 | 27.2 | 19.0 | 14.1 |
| 3 | 3 | north-carolina | 2 | West | 96.0 | 87.0 | 59.8 | 43.2 | 31.3 | 11.3 |
| 4 | 2 | kansas | 1 | Midwest | 93.9 | 79.0 | 56.7 | 43.2 | 10.8 | 5.4 |
| 5 | 13 | west-virginia | 5 | East | 87.6 | 71.3 | 36.8 | 11.7 | 7.2 | 4.3 |
| 6 | 9 | michigan-st | 3 | Midwest | 81.0 | 65.8 | 33.6 | 14.8 | 6.4 | 4.1 |
| 7 | 8 | michigan | 3 | West | 93.6 | 77.2 | 28.3 | 15.0 | 8.5 | 3.4 |
| 8 | 6 | cincinnati | 2 | South | 80.8 | 48.6 | 30.8 | 17.7 | 8.6 | 3.3 |
| 9 | 11 | gonzaga | 4 | West | 86.1 | 56.2 | 34.4 | 13.2 | 7.7 | 3.0 |
| 10 | 5 | virginia | 1 | South | 92.7 | 73.6 | 43.7 | 21.0 | 8.2 | 2.9 |
| 11 | 10 | duke | 2 | Midwest | 89.5 | 60.0 | 31.8 | 13.7 | 5.1 | 2.8 |
| 12 | 12 | xavier | 1 | West | 91.8 | 77.9 | 34.1 | 13.1 | 7.3 | 2.0 |
| 13 | 14 | nevada | 7 | South | 73.7 | 32.8 | 20.0 | 11.4 | 4.5 | 1.8 |
| 14 | 18 | auburn | 4 | Midwest | 59.9 | 34.4 | 15.8 | 6.7 | 2.5 | 1.3 |
| 15 | 16 | arizona | 4 | South | 74.0 | 36.2 | 16.3 | 8.6 | 3.5 | 1.3 |
| 16 | 15 | kentucky | 5 | South | 69.8 | 35.9 | 19.4 | 9.3 | 3.8 | 1.3 |
| 16 | 17 | ohio-st | 5 | West | 66.4 | 27.3 | 16.9 | 6.9 | 3.3 | 1.3 |
| 18 | 7 | tennessee | 3 | South | 81.7 | 62.7 | 28.2 | 15.1 | 4.7 | 0.9 |
| 19 | 19 | charleston | 13 | Midwest | 40.1 | 25.8 | 8.8 | 5.5 | 1.6 | 0.7 |
| 20 | 25 | arkansas | 7 | East | 72.6 | 10.4 | 6.3 | 2.5 | 1.5 | 0.7 |
| 21 | 27 | alabama | 9 | East | 77.9 | 22.4 | 7.5 | 2.2 | 1.2 | 0.5 |
| 22 | 21 | rhode-island | 7 | Midwest | 83.2 | 31.7 | 19.1 | 4.4 | 1.2 | 0.4 |
| 23 | 29 | florida | 6 | East | 64.8 | 37.8 | 5.8 | 1.9 | 1.1 | 0.4 |
| 24 | 20 | clemson | 5 | Midwest | 70.9 | 30.9 | 10.0 | 4.4 | 1.1 | 0.4 |
| 25 | 22 | kansas-st | 9 | South | 72.5 | 20.4 | 8.4 | 3.7 | 1.1 | 0.3 |
| 26 | 32 | texas-tech | 3 | East | 64.4 | 30.3 | 5.1 | 1.7 | 0.7 | 0.3 |
| 27 | 28 | loyola-il | 11 | South | 57.0 | 19.4 | 5.9 | 2.1 | 0.8 | 0.3 |
| 28 | 33 | providence | 10 | West | 58.8 | 8.1 | 3.9 | 1.7 | 0.8 | 0.3 |
| 29 | 26 | georgia-st | 15 | South | 19.2 | 9.3 | 5.1 | 2.5 | 0.8 | 0.3 |
| 30 | 30 | s-dakota-st | 12 | West | 33.7 | 11.0 | 5.6 | 1.7 | 0.8 | 0.3 |
| 31 | 23 | buffalo | 13 | South | 26.0 | 12.8 | 5.0 | 2.5 | 0.9 | 0.3 |
| 32 | 35 | marshall | 13 | East | 54.0 | 15.0 | 4.7 | 1.5 | 0.6 | 0.3 |
| 33 | 39 | nc-greensboro | 13 | West | 13.9 | 5.5 | 3.1 | 1.1 | 0.5 | 0.2 |
| 33 | 47 | radford | 16 | East | 14.5 | 5.8 | 2.1 | 0.7 | 0.3 | 0.2 |
| 35 | 31 | texas | 10 | South | 26.3 | 9.3 | 5.0 | 1.7 | 0.5 | 0.2 |
| 35 | 34 | nc-st | 9 | Midwest | 53.9 | 10.7 | 3.6 | 1.6 | 0.5 | 0.2 |
| 37 | 38 | bucknell | 14 | Midwest | 19.0 | 11.2 | 4.6 | 1.2 | 0.4 | 0.2 |
| 38 | 24 | davidson | 12 | South | 30.2 | 15.0 | 5.3 | 2.5 | 0.6 | 0.2 |
| 39 | 40 | ucla | 11 | East | 35.2 | 17.8 | 2.5 | 1.0 | 0.5 | 0.2 |
| 39 | 46 | butler | 10 | East | 27.4 | 3.6 | 1.9 | 0.8 | 0.4 | 0.2 |
| 41 | 42 | sf-austin | 14 | East | 35.6 | 14.0 | 2.4 | 1.0 | 0.4 | 0.2 |
| 42 | 36 | houston | 6 | West | 80.7 | 15.5 | 4.3 | 1.4 | 0.5 | 0.2 |
| 43 | 45 | seton-hall | 8 | Midwest | 46.1 | 8.9 | 2.7 | 0.8 | 0.3 | 0.1 |
| 44 | 37 | tcu | 6 | Midwest | 56.6 | 11.0 | 4.1 | 1.2 | 0.3 | 0.1 |
| 45 | 44 | new-mex-st | 12 | Midwest | 29.1 | 9.0 | 2.1 | 0.8 | 0.3 | 0.1 |
| 46 | 41 | arizona-st | 11 | Midwest | 43.4 | 12.0 | 3.8 | 1.0 | 0.3 | 0.1 |
| 47 | 43 | wright-st | 14 | South | 18.3 | 8.3 | 2.8 | 0.9 | 0.2 | 0.1 |
| 48 | 48 | missouri | 8 | West | 61.2 | 10.7 | 2.3 | 0.6 | 0.2 | 0.1 |
| 49 | 55 | montana | 14 | West | 6.4 | 3.8 | 0.9 | 0.3 | 0.1 | 0.1 |
| 50 | 50 | florida-st | 9 | West | 38.8 | 7.9 | 2.5 | 0.5 | 0.2 | 0.1 |
| 51 | 51 | miami-fl | 6 | South | 43.0 | 9.6 | 2.1 | 0.5 | 0.1 | 0.1 |
| 51 | 57 | creighton | 8 | South | 27.5 | 4.0 | 1.2 | 0.3 | 0.1 | 0.1 |
| 53 | 62 | virginia-tech | 8 | East | 22.1 | 1.8 | 0.5 | 0.2 | 0.1 | 0.0 |
| 54 | 54 | iona | 15 | Midwest | 10.5 | 4.1 | 1.5 | 0.3 | 0.1 | 0.0 |
| 55 | 49 | texas-am | 7 | West | 41.2 | 3.6 | 1.4 | 0.5 | 0.1 | 0.0 |
| 55 | 52 | tx-southern | 16 | West | 8.2 | 3.6 | 1.0 | 0.4 | 0.1 | 0.0 |
| 55 | 60 | umbc | 16 | South | 7.3 | 1.9 | 0.6 | 0.2 | 0.1 | 0.0 |
| 58 | 58 | san-diego-st | 11 | West | 19.3 | 3.5 | 0.9 | 0.3 | 0.1 | 0.0 |
| 59 | 56 | wichita-st | 4 | East | 46.0 | 9.5 | 0.9 | 0.3 | 0.1 | 0.0 |
| 60 | 53 | oklahoma | 10 | Midwest | 16.8 | 4.2 | 1.5 | 0.3 | 0.1 | 0.0 |
| 61 | 59 | murray-st | 12 | East | 12.4 | 4.2 | 1.1 | 0.3 | 0.1 | 0.0 |
| 62 | 61 | lipscomb | 15 | West | 4.0 | 1.3 | 0.5 | 0.2 | 0.0 | 0.0 |
| 63 | 63 | pennsylvania | 16 | Midwest | 6.1 | 1.5 | 0.3 | 0.1 | 0.0 | 0.0 |
| 64 | 64 | cal-st-fullerton | 15 | East | 1.4 | 0.4 | 0.2 | 0.0 | 0.0 | 0.0 |
1This simulation is compiled of 10,000 tournament simulation for each of our 6 probabilistic models (60,000 tournaments in total). For each tournament, random numbers were generated for each game and compared with the given model’s win probability for that game (advancing either Team1 or Team2 depending on where the random number fell). For example, consider tournament #1, model #1, and game #1. For this game, model #1’s win probability for Team1 is 90%. A random number between 0 and 1 is generated – if the number generated is greater than 0.90, we advance Team2 to the next round, and if it is 0.90 or less, we advance Team1 to the next round. This process is repeated for each game until there is a tournament champion, repeated 10,000 times for each model. Each model’s predictions have equal weighting in the results.
66 thoughts on “Bracket Analysis | March Madness 2018”
Comments are closed.