Select any 2019 NBA Draft prospect from the drop-down menu below to view their top 10 most similar college basketball players, as measured by our Similarity Score model. Similarity Scores provide insight into how a player will translate to the NBA based on how their historical comparisons have performed in the NBA. This model considers a player’s college production, physical measurements, and age/experience to generate their most similar historical players. For more background on the calculation of the similarity scores, see this article. This model is one of three pieces that we use to evaluate the NBA potential of college players, with the other two being PNSP and NBA Role Probability Model.
Continue reading 2019 Similarity Score Tool
All posts by Jack Werner
2019 NBA Role Probability Model
The NBA Role Probability Model predicts the likelihood that a given college basketball player becomes an All-Star, starter, bench player, or does not make it in the NBA. The model considers individual box score statistics, team-level statistics (e.g. strength of schedule), physical measurements, high school scouting rank, position, and age/experience to predict the probability of a player landing each NBA role. For more detail on how this model is formulated, see this article. The Role Probability model is one of three pieces that we use to evaluate the NBA potential of college and international players, with the other two being PNSP and Similarity Scores. In the table below, you can find the model’s predicted probabilities for each 2019 prospect landing in a given role in the NBA.
Continue reading 2019 NBA Role Probability Model
2019 Peak NBA Statline Projection Model
Peak NBA Statline Projection (PNSP) is a model used to project NBA success for college and International basketball players. PNSP considers each player’s individual and team statistics, physical measurements, high school scouting ranking, and age/experience. The PNSP model returns a single rating value from 0 to 100, with higher values indicating a “better” NBA prospect. We provide a detailed article outlining how PNSP is formulated here, and PNSP rankings from previous years can be found here. Below are a few highlights for the 2019 NBA Draft Class, and a listing of each player’s PNSP.
Checking in on the Model 284 March Madness pool
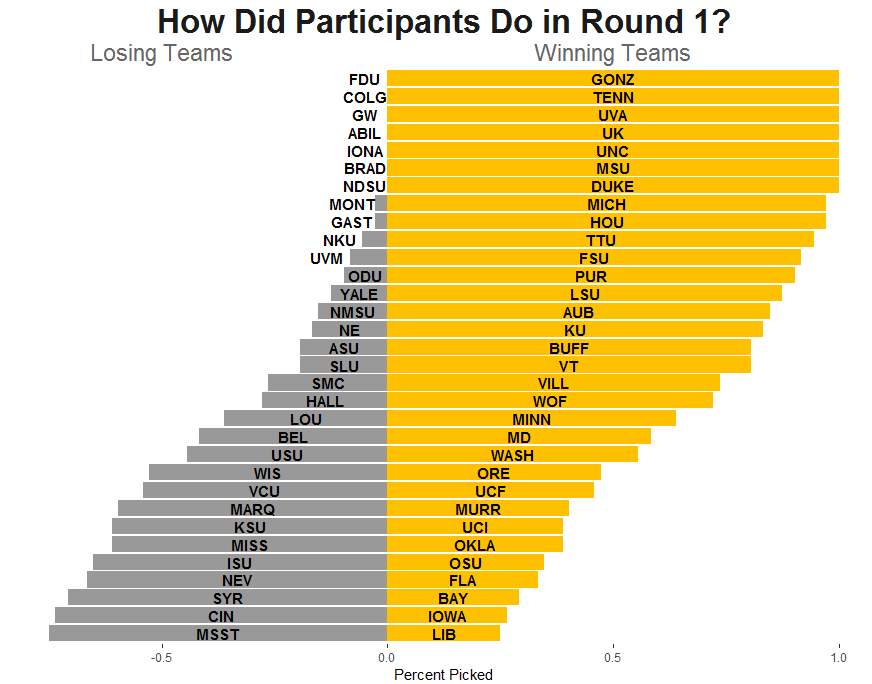
The first week of March Madness is in the books, and so far the tournament has been more predictable than usual. Five teams seeded 11 or higher made it past the first round, but only one of those—Oregon—made it through to the Sweet 16. They, along with five-seed Auburn, were the only teams to advance through the first two rounds who weren’t seeded four or lower.
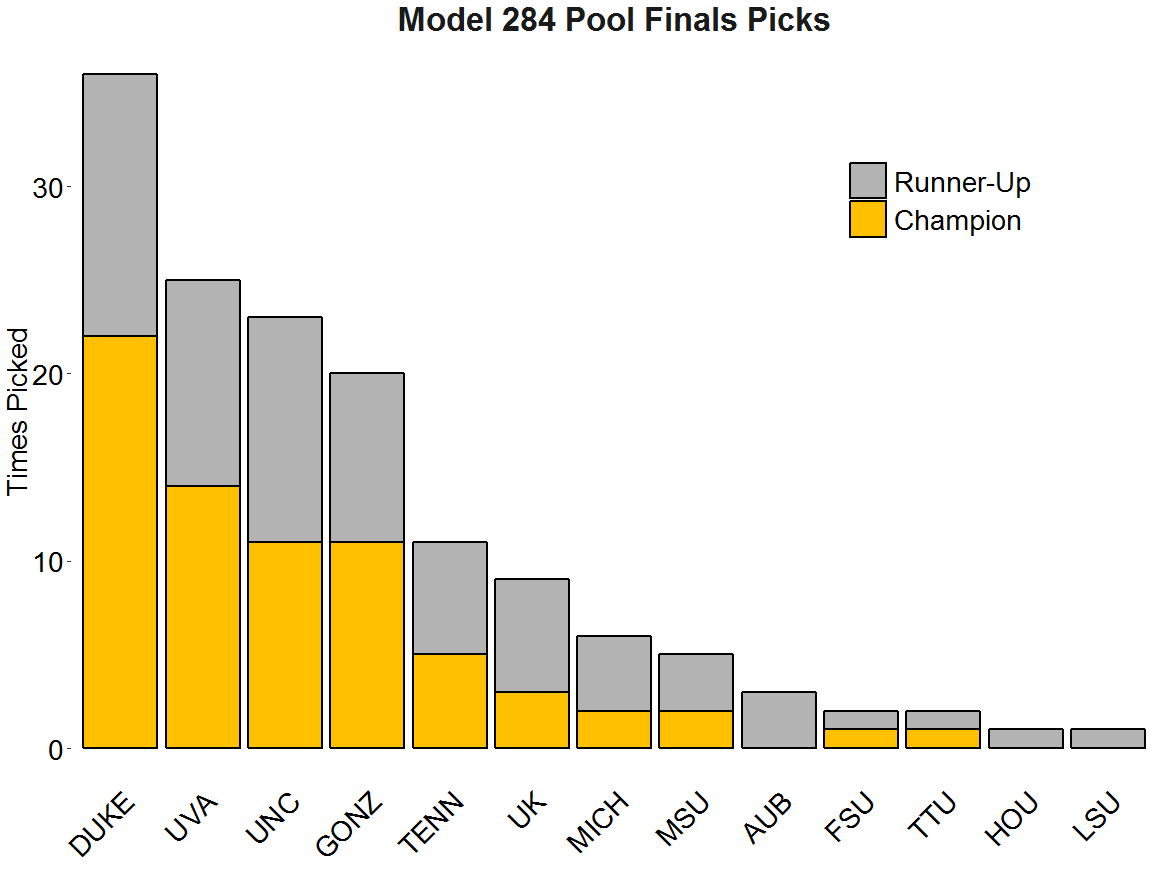
All this chalk means the brackets in our Model 284 pool are in pretty good shape. None of you has lost your champion or runner-up yet, a remarkable occurrence given that thirteen different teams were finals picks of one bracket or another. Fifty-eight of your seventy-two entries haven’t lost a single Final 4 team. Thirty-one of you could still have a perfect Elite 8 as well. Last year at this stage, the leader had 470 points. This year, in a pool of almost the same size, thirty people have a higher score than that. And it’s not just our pool who has had it good; for the very first time, someone in the NCAA Bracket Challenge picked the first two rounds perfectly.
So long story short, your brackets look pretty good. All of you correctly picked all of the one- and two-seeds, save for the brackets “JGR Official” and “Official 2”, which officially got too cute by picking Montana over Michigan. Liberty, Iowa, and Baylor’s victories threw you off the most, but even still, each of those teams were picked by around a quarter of you.
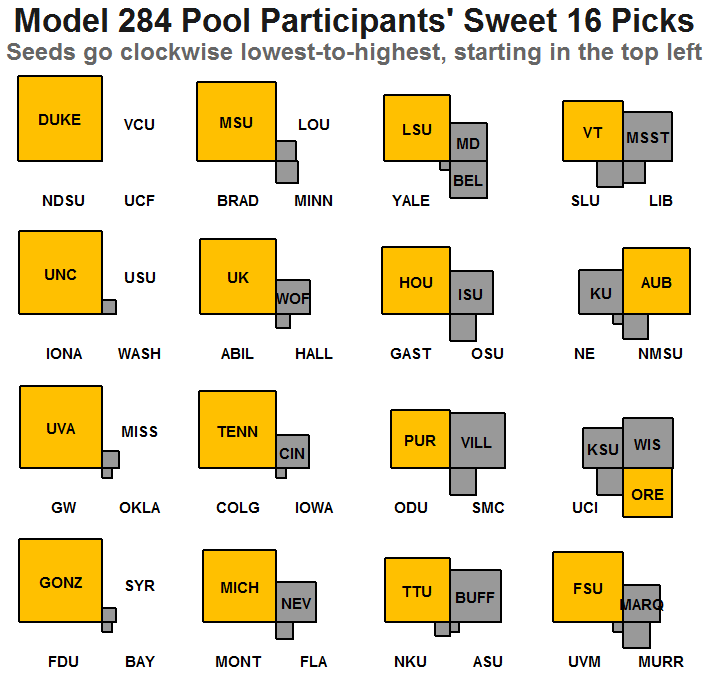
Your Sweet 16 picks were equally impressive. Everybody picked Duke to make it to the second weekend, though UCF came dangerously close to proving you all wrong. Save for one, each given Sweet 16 team was picked more frequently than the three others vying for its spot. The exception was 12-seed Oregon, and even then, they were picked by more of you than 4-seed Kansas State and almost as many as 5-seed Wisconsin, Oregon’s two lower-seeded competitors.
Looking ahead to the rest of the tournament, it’s anybody’s game. With everybody’s finals picks still in the running, the rest of the tournament will be an exciting watch! Good luck to all of you.
2018 Fantasy Football Rankings
FOOTBALL IS FINALLY BACK! And since there is such a shortage of Fantasy Football content out there, we thought we needed to give the people some material to prepare for their drafts. The following rankings are loosely based on model predictions for each position, which use historical player/team data to predict fantasy points for the coming season (i.e., separate models for QB, RB, WR, TE, K, DST). That said, there are plenty of factors that any model will have trouble capturing perfectly (injury status, team depth charts, suspensions, QB/Coach changes, etc.), and thus we have made some subjective adjustments to the rankings where necessary. For example, if a model weighs last year’s cumulative statistics too heavily, Odell Beckham Jr. is not going to come out very high since he only played 4 games. Our rankings can be found below, along with a short description of the model we used for each position. All rankings reflect PPR scoring.
To download our rankings, click here Continue reading 2018 Fantasy Football Rankings
2018 Similarity Score Tool
Select any 2018 NBA Draft prospect from the drop-down menu below to view their top 10 most similar college basketball players. Similarity Scores provide insight into how a player will translate to the NBA based on how their historical comparisons have performed in the NBA. This model considers a player’s college production, physical measurements, and age/experience to generate their most similar historical players. For more background on the calculation of the similarity scores, see this article. This model is one of three pieces that we use to evaluate the NBA potential of college players, with the other two being PNSP and NBA Role Probability Model.
Continue reading 2018 Similarity Score Tool
2018 NBA Role Probability Model
The NBA Role Probability Model predicts the likelihood that a given college basketball player becomes an All-Star, starter, bench player, or does not make it in the NBA. The model considers individual box score statistics, team-level statistics (e.g. strength of schedule), physical measurements, high school scouting rank, position, and age/experience to predict the probability of a player landing each NBA role. For more detail on how this model is formulated, see this article. The Role Probability model is one of three pieces that we use to evaluate the NBA potential of college and international players, with the other two being PNSP and Similarity Scores. In the table below, you can find the model’s predicted probabilities for each 2018 prospect landing in a given role in the NBA.
Continue reading 2018 NBA Role Probability Model
2018 Peak NBA Statline Projection Model
Peak NBA Statline Projection (PNSP) is a model used to project NBA success for college and International basketball players. PNSP considers each player’s individual and team statistics, physical measurements, high school scouting ranking, and age/experience. The PNSP model returns a single rating value from 0 to 100, with higher values indicating a “better” NBA prospect. We provide a detailed article outlining how PNSP is formulated here, and PNSP rankings from previous years can be found here. Below are a few highlights from PNSP’s ratings for the 2018 NBA Draft Class.
Model 284 Podcast: NBA Draft Models
On this episode of the Model 284 Podcast, Sam and Marc are joined by fellow Model 284er Jack Werner to give some background on our NBA Draft models, discuss draft theory and positional value, and look a bit at the 2018 draft class.
My Model Monday: Visualizing Hitter Performance
All-encompassing stats are great for many things. WAR has become the standard for comparing baseball players because, more than any other stat, it encapsulates all of a player’s contributions in one number. On the offensive side, stats like OPS and wOBA provide a single stat that basically amount to offensive production per plate appearance. Stats like these are useful both in that they assign values to the different ways in which players provide value, and because universal measures allow easy comparisons between players. Want to know whether Giancarlo Stanton or Joey Votto was a more productive hitter last year? No number will give a perfect answer, but wOBA will get you close.
Continue reading My Model Monday: Visualizing Hitter Performance