The NBA Role Probability Model predicts the likelihood that a given college basketball player becomes an All-Star, starter, bench player, or does not make it in the NBA. The model considers individual box score statistics, team-level statistics (e.g. strength of schedule), physical measurements, high school scouting rank, position, and age/experience to predict the probability of a player landing each NBA role. For more detail on how this model is formulated, see this article. The Role Probability model is one of three pieces that we use to evaluate the NBA potential of college and international players, with the other two being PNSP and Similarity Scores. In the table below, you can find the model’s predicted probabilities for each 2019 prospect landing in a given role in the NBA.
Continue reading 2019 NBA Role Probability Model
2019 Peak NBA Statline Projection Model
Peak NBA Statline Projection (PNSP) is a model used to project NBA success for college and International basketball players. PNSP considers each player’s individual and team statistics, physical measurements, high school scouting ranking, and age/experience. The PNSP model returns a single rating value from 0 to 100, with higher values indicating a “better” NBA prospect. We provide a detailed article outlining how PNSP is formulated here, and PNSP rankings from previous years can be found here. Below are a few highlights for the 2019 NBA Draft Class, and a listing of each player’s PNSP.
2019 Wide Receiver Draft Model
Our Wide Receiver draft model incorporates player and team level college statistics and NFL Combine metrics to generate predicted probabilities of possible outcomes for each player’s NFL career. We focus on each player’s likelihood of making a Probowl, becoming a starter, becoming a role player (3rd – 5th wide receiver), or not making it in the NFL. Continue reading 2019 Wide Receiver Draft Model
2019 NBA Bracket and Simulation
2019 NBA Playoffs Bracket and Simulation
Below is our projected bracket and simulation results for the 2019 NBA playoffs. These probabilities were generated from a combination of models that are trained on data from the regular season. Continue reading 2019 NBA Bracket and Simulation
Game Predictions | March Madness 2019
The tables below provide our predictions for all games in the 2019 NCAA Tournament. The tables will be updated after each round of the tournament, with new games/predictions added as they become available. A brief description of how to interpret the predictions is provided above each table, and a summary of the historical accuracy of each model is provided at the end of the post.
Continue reading Game Predictions | March Madness 2019
Checking in on the Model 284 March Madness pool
The first week of March Madness is in the books, and so far the tournament has been more predictable than usual. Five teams seeded 11 or higher made it past the first round, but only one of those—Oregon—made it through to the Sweet 16. They, along with five-seed Auburn, were the only teams to advance through the first two rounds who weren’t seeded four or lower.
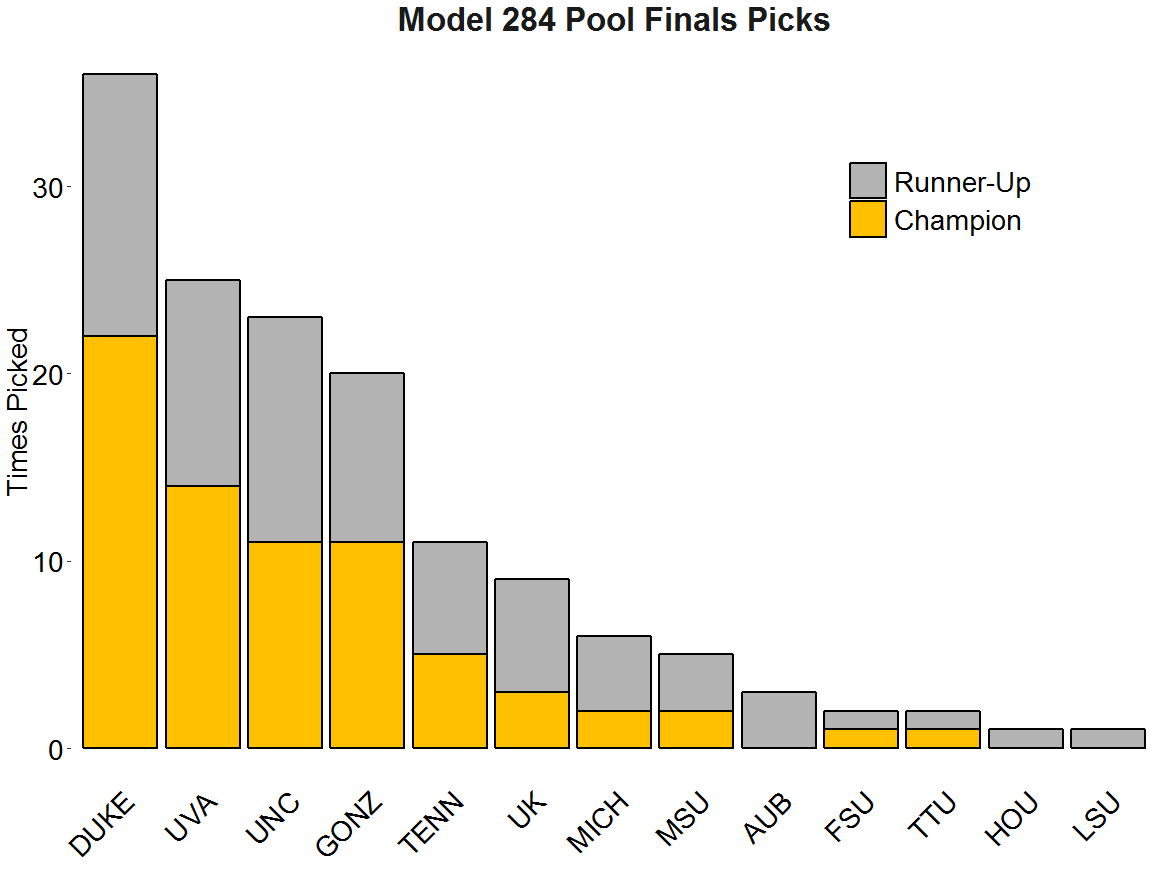
All this chalk means the brackets in our Model 284 pool are in pretty good shape. None of you has lost your champion or runner-up yet, a remarkable occurrence given that thirteen different teams were finals picks of one bracket or another. Fifty-eight of your seventy-two entries haven’t lost a single Final 4 team. Thirty-one of you could still have a perfect Elite 8 as well. Last year at this stage, the leader had 470 points. This year, in a pool of almost the same size, thirty people have a higher score than that. And it’s not just our pool who has had it good; for the very first time, someone in the NCAA Bracket Challenge picked the first two rounds perfectly.
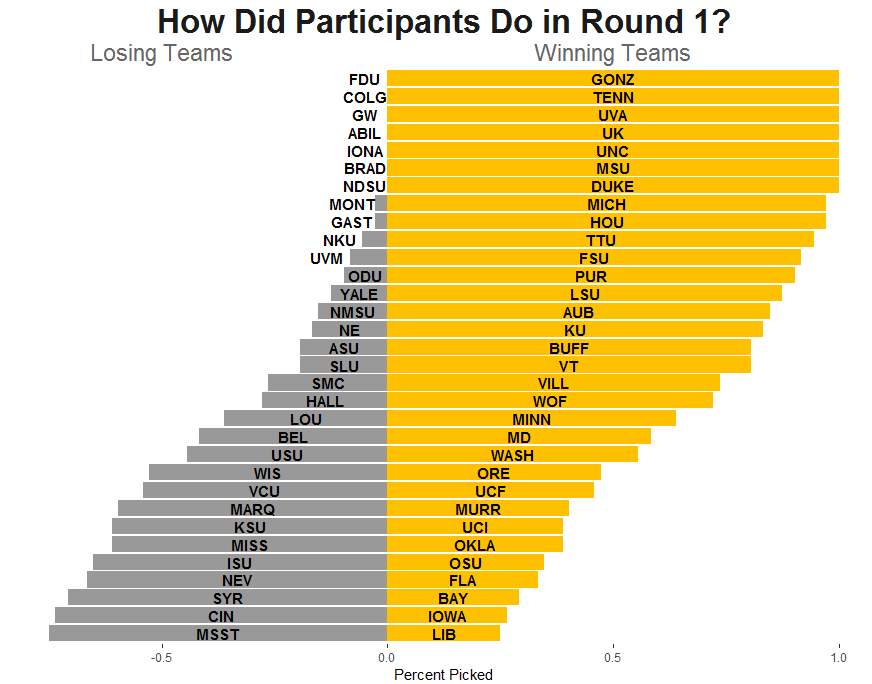
So long story short, your brackets look pretty good. All of you correctly picked all of the one- and two-seeds, save for the brackets “JGR Official” and “Official 2”, which officially got too cute by picking Montana over Michigan. Liberty, Iowa, and Baylor’s victories threw you off the most, but even still, each of those teams were picked by around a quarter of you.
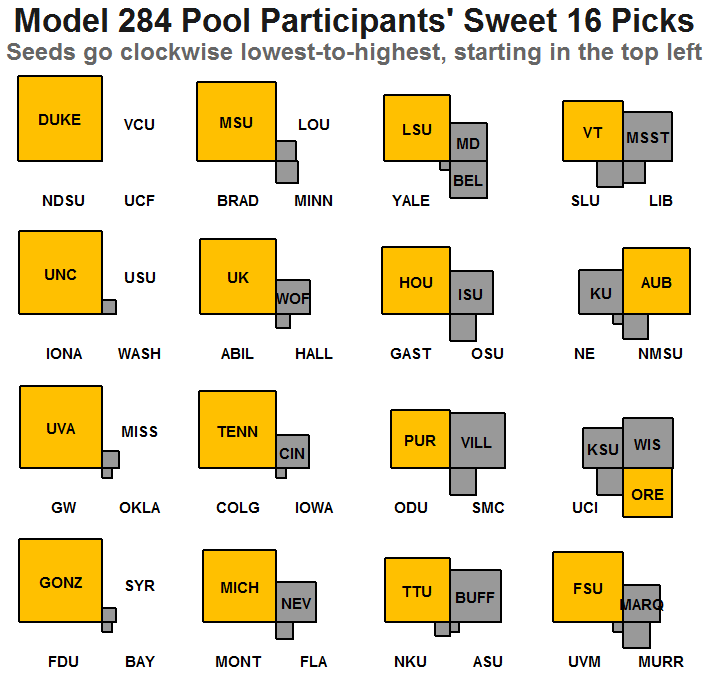
Your Sweet 16 picks were equally impressive. Everybody picked Duke to make it to the second weekend, though UCF came dangerously close to proving you all wrong. Save for one, each given Sweet 16 team was picked more frequently than the three others vying for its spot. The exception was 12-seed Oregon, and even then, they were picked by more of you than 4-seed Kansas State and almost as many as 5-seed Wisconsin, Oregon’s two lower-seeded competitors.
Looking ahead to the rest of the tournament, it’s anybody’s game. With everybody’s finals picks still in the running, the rest of the tournament will be an exciting watch! Good luck to all of you.
Model 284 Bracket | March Madness 2019
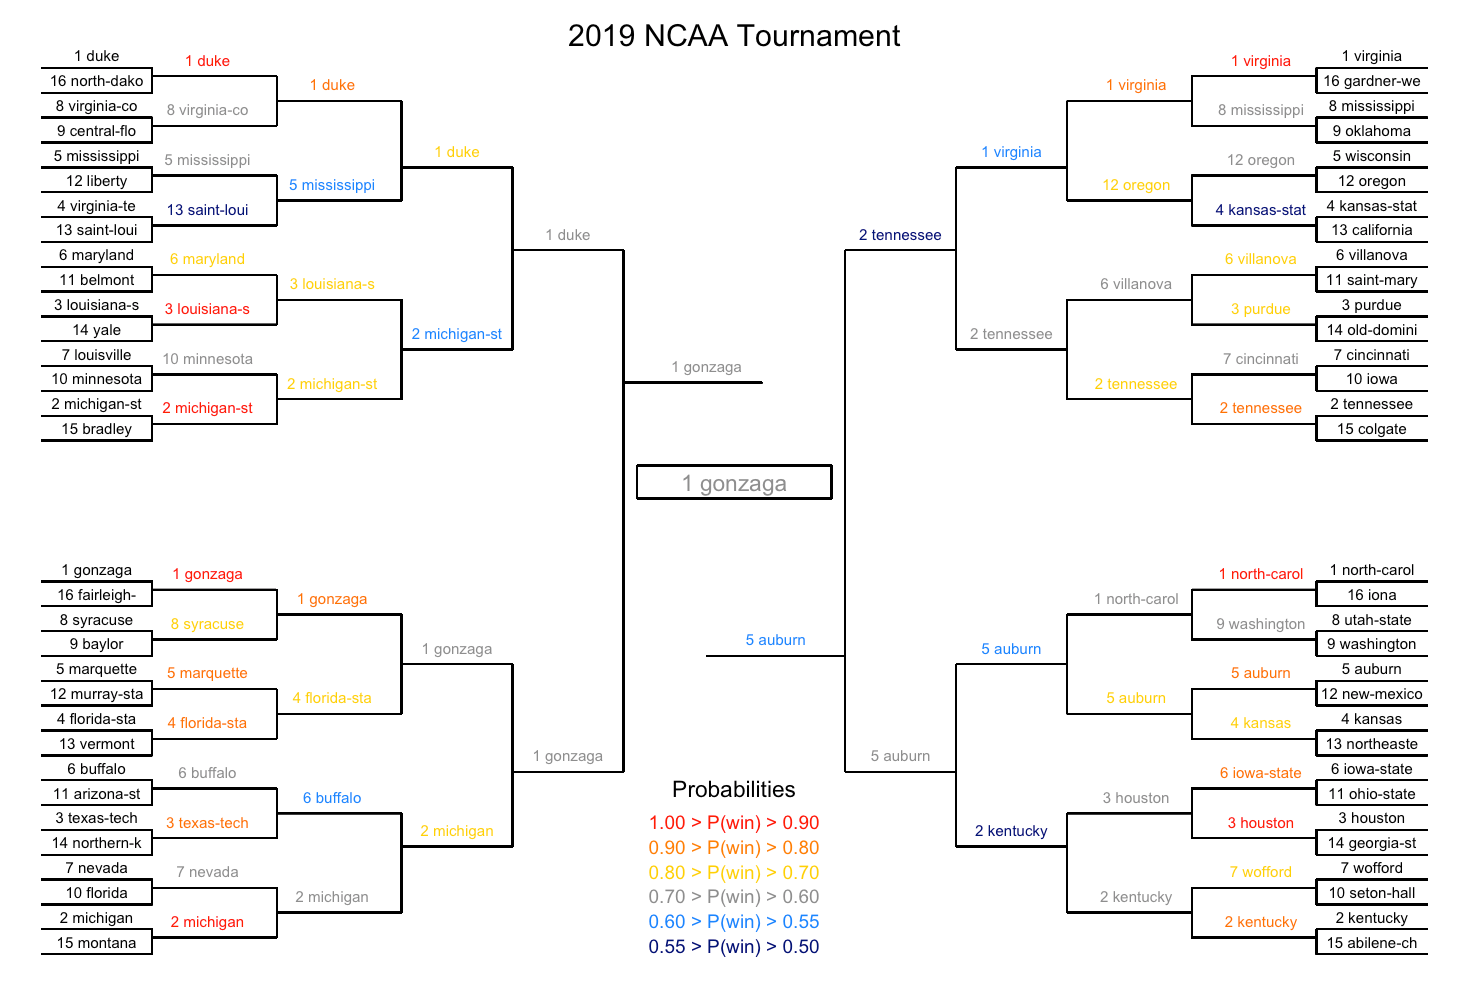
Below is our Model 284 consensus bracket for the 2019 NCAA Tournament. As you will see from our Game-by-Game Predictions and Tournament Simulation results, our bracket does not necessarily advance our model’s predicted winner for every single game. Rather, we use a combination of (1) our model’s individual game predictions, (2) our tournament simulation results, (3) injuries / other factors not captured by our models, and (4) consideration of public picks – to make sure we are differentiating our bracket enough from the most popular choices. For those interested, here is a bracket filled out purely using model predictions. Continue reading Model 284 Bracket | March Madness 2019
Tournament Simulation | March Madness 2019
The article below shows how our models view this year’s tournament field from a simulation perspective. Each table shows the % chance that each team advances to a given round of the tournament (e.g., in the first table, Duke has a 97% chance of advancing to the 2nd round). These figures are calculated based on 60,000 simulations1 of this year’s tournament, which were performed using win probability predictions from our models. Note that play-in game teams are subject to change and are denoted with an *. Continue reading Tournament Simulation | March Madness 2019
Model 284 March Madness Pool
Can you beat the Model? Enter a March Madness bracket into the group Model 284 for a chance to take on The Model. The winning bracket will receive a $100 Cash Prize and Second Place will receive a Model 284 Quarter Zip!
2018 NFL Game Predictions
The following table contains our spread and total predictions for each NFL game. We will update this post with new predictions/matchups each week and keep track of how our models perform against the closing Vegas lines for each game. Our models are built using a combination of variables, including our Elo Ratings, Vegas spreads/totals, situational factors, team statistics (from a team’s last 7 games played), historical QB rating of the starting QBs, and more. Our predictions are generated as a composite (i.e., the average of multiple models). We are working on a more detailed write up on our modeling methodology that we will eventually link in here.
Continue reading 2018 NFL Game Predictions