With the NBA and NHL playoffs in full swing, it gives us a good chance to look at which teams over/underachieved during the regular season using Pythagorean Win Expectation, and, in turn, what teams could exceed expectations in the playoffs.
Pythagorean Win Expectation is a formula that uses a team’s scoring differential to estimate how many games that team should win (rather than looking at how many games they actually won) using the formula below, where  can be optimized in different ways, depending on the sport and number of games played:

The better team doesn’t win every game, and even over a long season, actual wins are not always the best indicator of team skill. We can compare a team’s Pythagorean Wins to their actual wins to get a sense for whether they won more or fewer games than they “should” have won. In theory, a team who underachieved during the regular season should start to trend toward their true wins as they play more games (i.e., they should win at a higher rate in the playoffs). Similarly, a team who won way more games than they should have during the regular season could cool off quickly in the playoffs. There are other factors to consider (injuries, strength of schedule) before blindly following that logic, but in general, that’s the idea.
NBA
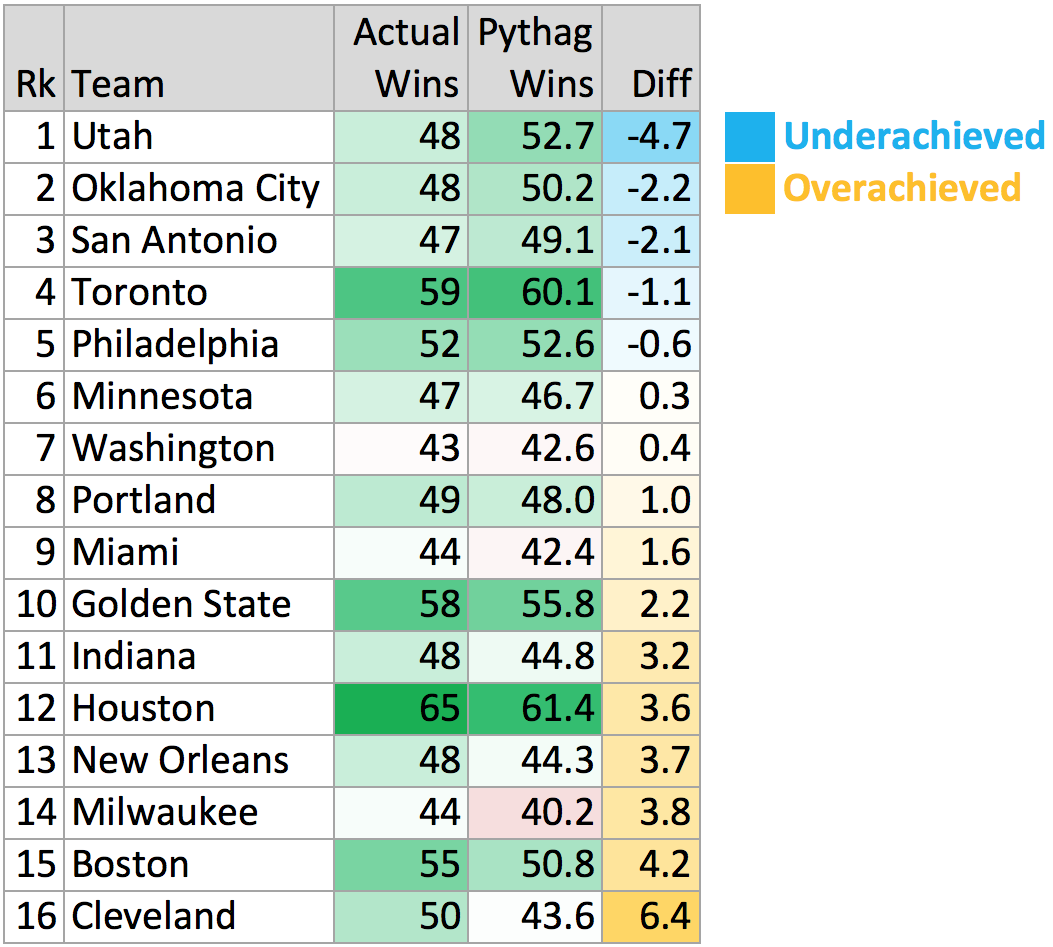
First off, this year’s playoff field is littered with important injuries, which makes things difficult from an analytical standpoint, and thus these numbers should be taken with a grain of salt for certain teams. At first glance, it makes sense to see the more star-driven teams (Cavs, Pelicans, Bucks) as the biggest overachievers. The Utah Jazz stand out as the biggest underachiever from the regular season, finishing almost five wins short of their Pythagorean expectation. Here are actual wins, Pythagorean wins, and their difference for this year’s playoff teams (a list of all NBA teams can be found at the bottom of the article):
NHL
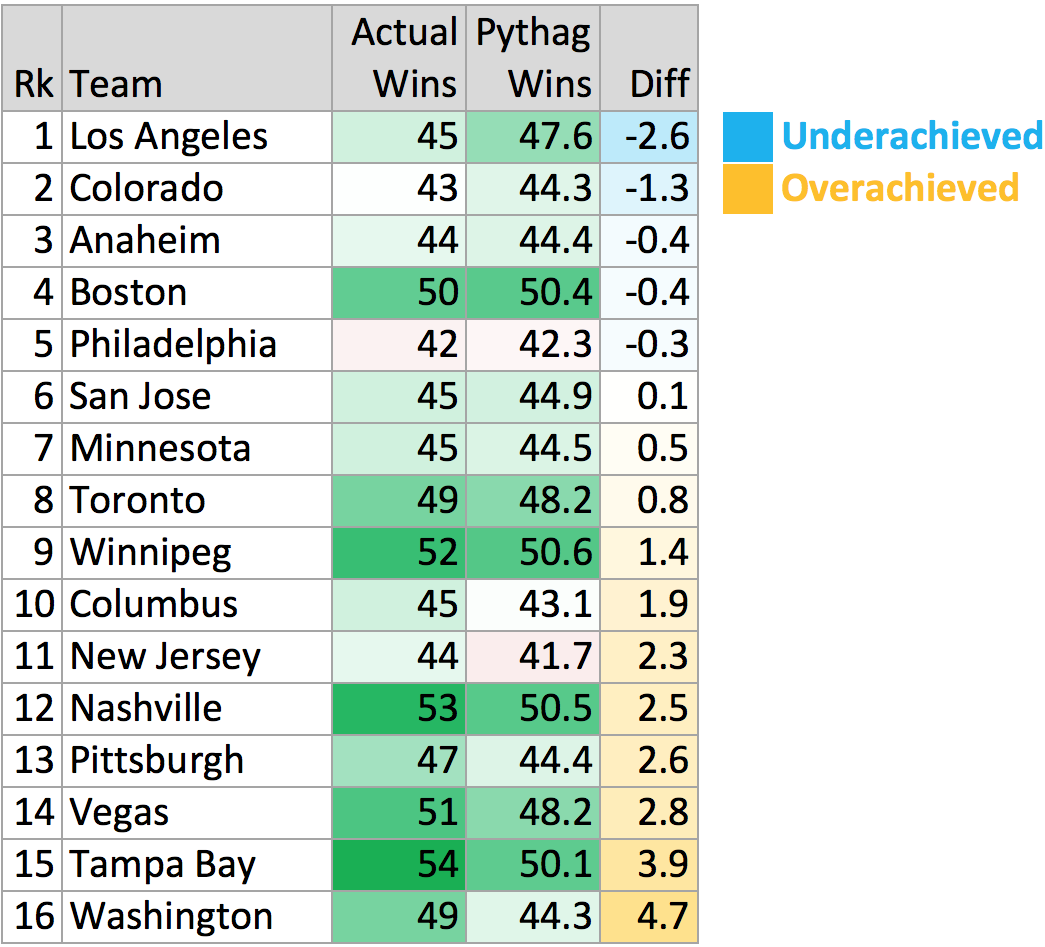
For Hockey, we see most of the top teams finishing in the overachiever category, which makes sense given the higher variability in scoring in Hockey relative to basketball. Interestingly, the Los Angeles Kings were the most underachieving team and were considered to be a favorite among wild-card teams to make a run for the cup, but they have already been swept by the Vegas Golden Knights (albeit all one-goal games). Here are actual wins, Pythagorean wins, and their difference for this year’s playoff teams (a list of all NHL teams can be found at the bottom of the article):
NBA – All Teams
| Team | Made Playoffs | Actual Wins | Pythag Wins | Diff |
|---|---|---|---|---|
| HOU | 1 | 65 | 61.4 | +3.6 |
| TOR | 1 | 59 | 60.1 | -1.1 |
| GSG | 1 | 58 | 55.8 | +2.2 |
| BOS | 1 | 55 | 50.8 | +4.2 |
| PHI | 1 | 52 | 52.6 | -0.6 |
| CLE | 1 | 50 | 43.6 | +6.4 |
| POR | 1 | 49 | 48.0 | +1.0 |
| OKC | 1 | 48 | 50.2 | -2.2 |
| UTA | 1 | 48 | 52.7 | -4.7 |
| IND | 1 | 48 | 44.8 | +3.2 |
| NOP | 1 | 48 | 44.3 | +3.7 |
| SAS | 1 | 47 | 49.1 | -2.1 |
| MIN | 1 | 47 | 46.7 | +0.3 |
| DEN | 0 | 46 | 44.9 | +1.1 |
| MIA | 1 | 44 | 42.4 | +1.6 |
| MIL | 1 | 44 | 40.2 | +3.8 |
| WSH | 1 | 43 | 42.6 | +0.4 |
| LAC | 0 | 42 | 41.0 | +1.0 |
| DET | 0 | 39 | 40.7 | -1.7 |
| CHA | 0 | 36 | 41.5 | -5.5 |
| LAL | 0 | 35 | 37.1 | -2.1 |
| NYN | 0 | 29 | 31.8 | -2.8 |
| BKN | 0 | 28 | 31.4 | -3.4 |
| SAC | 0 | 27 | 22.8 | +4.2 |
| CHI | 0 | 27 | 23.2 | +3.8 |
| ORL | 0 | 25 | 28.5 | -3.5 |
| DAL | 0 | 24 | 32.6 | -8.6 |
| ATL | 0 | 24 | 27.1 | -3.1 |
| MEM | 0 | 22 | 24.7 | -2.7 |
| PHX | 0 | 21 | 18.9 | +2.1 |
NHL – All Teams
| Team | Made Playoffs | Actual Wins | Pythag Wins | Diff |
|---|---|---|---|---|
| NSH | 1 | 53 | 50.5 | +2.5 |
| WPG | 1 | 52 | 50.6 | +1.4 |
| TB | 1 | 54 | 50.1 | +3.9 |
| BOS | 1 | 50 | 50.4 | -0.4 |
| VGS | 1 | 51 | 48.2 | +2.8 |
| WSH | 1 | 49 | 44.3 | +4.7 |
| TOR | 1 | 49 | 48.2 | +0.8 |
| MIN | 1 | 45 | 44.5 | +0.5 |
| ANA | 1 | 44 | 44.4 | -0.4 |
| PIT | 1 | 47 | 44.4 | +2.6 |
| SJS | 1 | 45 | 44.9 | +0.1 |
| LAK | 1 | 45 | 47.6 | -2.6 |
| PHI | 1 | 42 | 42.3 | -0.3 |
| CBJ | 1 | 45 | 43.1 | +1.9 |
| NJN | 1 | 44 | 41.7 | +2.3 |
| FLA | 0 | 44 | 41.3 | +2.7 |
| COL | 1 | 43 | 44.3 | -1.3 |
| STL | 0 | 44 | 41.7 | +2.3 |
| DAL | 0 | 42 | 42.8 | -0.8 |
| CGY | 0 | 37 | 35.7 | +1.3 |
| CAR | 0 | 36 | 36.3 | -0.3 |
| NYI | 0 | 35 | 36.3 | -1.3 |
| EDM | 0 | 36 | 36.2 | -0.2 |
| NYR | 0 | 34 | 35.0 | -1.0 |
| CHI | 0 | 33 | 36.4 | -3.4 |
| VAN | 0 | 31 | 33.2 | -2.2 |
| DET | 0 | 30 | 34.4 | -4.4 |
| MTL | 0 | 29 | 31.6 | -2.6 |
| ARI | 0 | 29 | 32.6 | -3.6 |
| OTT | 0 | 28 | 30.0 | -2.0 |
| BUF | 0 | 25 | 27.5 | -2.5 |