Below is our Model 284 consensus bracket for the 2021 NCAA Tournament. As you will see from our Game-by-Game Predictions and Tournament Simulation results, our bracket does not necessarily advance our model’s predicted winner for every single game. Rather, we use a combination of (1) our model’s individual game predictions, (2) our tournament simulation results, (3) injuries / other factors not captured by our models, and (4) consideration of public picks – to make sure we are differentiating our bracket enough from the most popular choices. For those interested, here is a bracket filled out purely using raw model output. Continue reading Model 284 Bracket | March Madness 2021
All posts by Sam Walczak
Tournament Simulation | March Madness 2021
The article below shows how our models view this year’s tournament field from a simulation perspective. Each table shows the % chance that each team advances to a given round of the tournament (e.g., in the first table, Gonzaga has a 92.5% chance of advancing to the 2nd round). These figures are calculated based on 1,000 simulations of this year’s tournament, which were performed using win probability and spread predictions from our models. See our related posts for our Full 2021 Tournament Bracket and our Game-by-Game Predictions. Continue reading Tournament Simulation | March Madness 2021
2021 NFL Big Data Bowl Submission
A Framework for Accessing Individual Defensive Performance in Coverage
1. Introduction
Current defensive coverage metrics are only calculated on plays where that defender’s assigned offensive player is the one targeted. This approach is flawed and incomplete. On any given play, there are around five available receivers, and the best coverage may prevent the quarterback from even throwing the ball to a given receiver. Further, these metrics identify coverage assignment simply by considering the responsible defender to be the nearest one at the time the ball arrives. Thus, this methodology only gives us coverage assignment for one player per play, and even that assignment is questionable; the closest defender at one particular moment isn’t necessarily the assigned defender.
The work presented here illustrates a framework we’ve developed to address these shortcomings. Our approach begins by identifying the responsibilities of each defender on a given play. If a player is in man (everywhere) coverage, he is assigned a specific offensive player whom he is to cover until the ball is thrown. On the other hand, if a player is in zone coverage, he is instead responsible for an area and any receivers who enter that area. Because the responsibilities of a player differ in each coverage type, the evaluation of performance should be different for each. Once we identify the type of coverage being played by each defender, we then consider two separate time points for evaluation. For one, we consider the time frame after the pass is thrown. This is the most straightforward but limits us to only the targeted receivers, as players tend to abandon their assignments and converge to the ball once it is thrown. To include all defenders in our analysis, we also consider the time frame between the snap and the pass. Figure 1 below illustrates our proposed framework…….
Read our full paper on Kagge here: https://www.kaggle.com/model284/a-defensive-player-coverage-evaluation-framework
Game Predictions | March Madness 2019
The tables below provide our predictions for all games in the 2019 NCAA Tournament. The tables will be updated after each round of the tournament, with new games/predictions added as they become available. A brief description of how to interpret the predictions is provided above each table, and a summary of the historical accuracy of each model is provided at the end of the post.
Continue reading Game Predictions | March Madness 2019
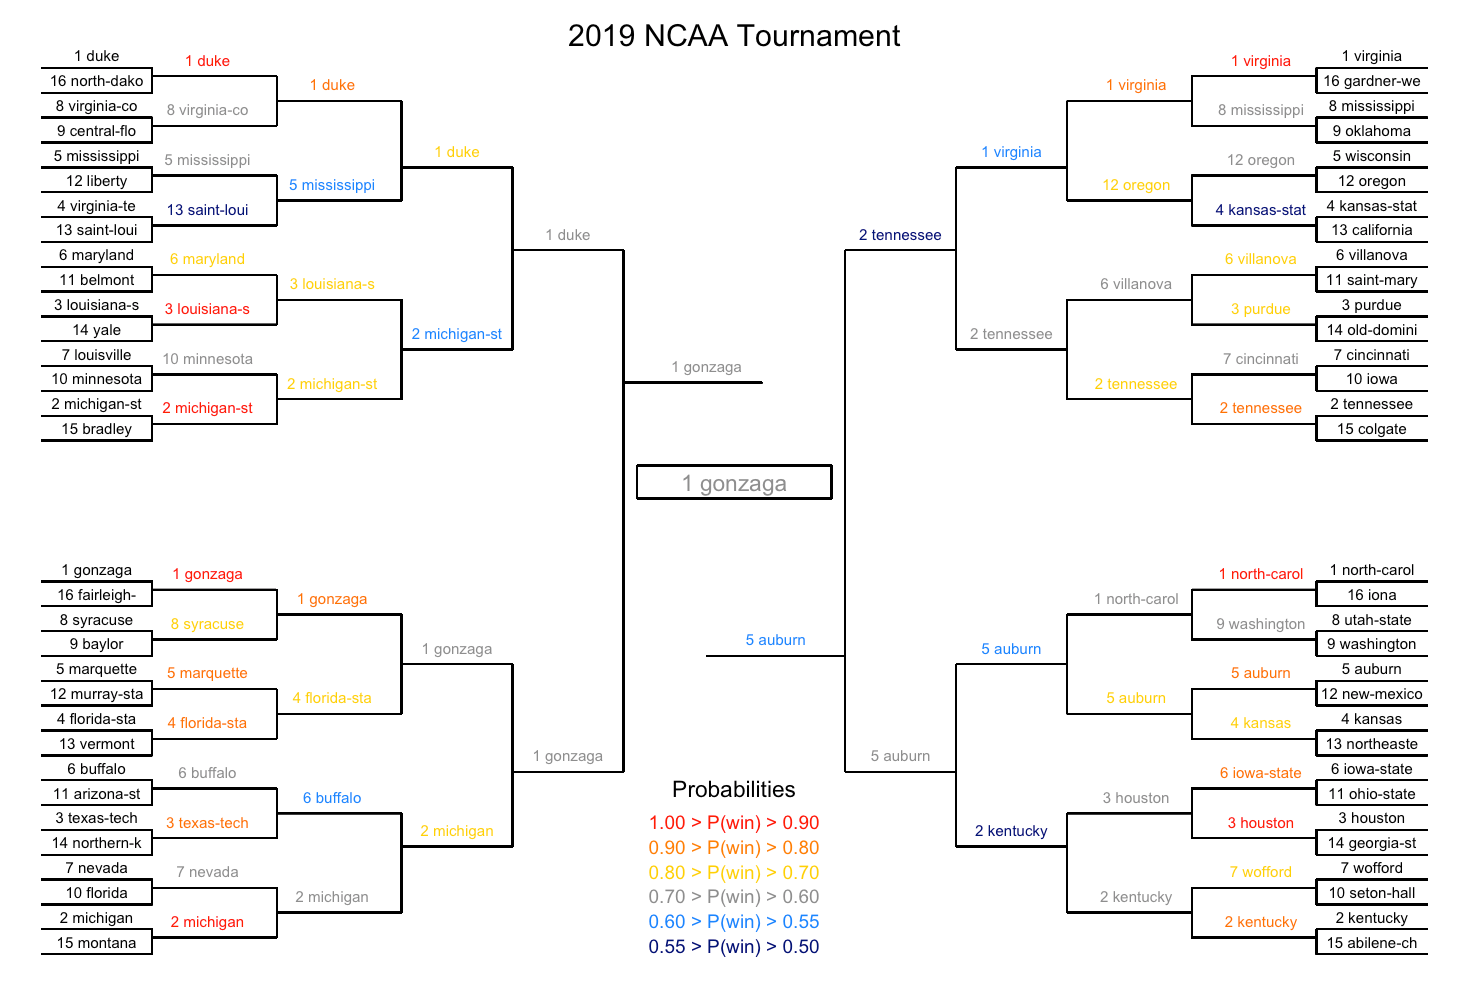
Model 284 Bracket | March Madness 2019
Below is our Model 284 consensus bracket for the 2019 NCAA Tournament. As you will see from our Game-by-Game Predictions and Tournament Simulation results, our bracket does not necessarily advance our model’s predicted winner for every single game. Rather, we use a combination of (1) our model’s individual game predictions, (2) our tournament simulation results, (3) injuries / other factors not captured by our models, and (4) consideration of public picks – to make sure we are differentiating our bracket enough from the most popular choices. For those interested, here is a bracket filled out purely using model predictions. Continue reading Model 284 Bracket | March Madness 2019
Tournament Simulation | March Madness 2019
The article below shows how our models view this year’s tournament field from a simulation perspective. Each table shows the % chance that each team advances to a given round of the tournament (e.g., in the first table, Duke has a 97% chance of advancing to the 2nd round). These figures are calculated based on 60,000 simulations1 of this year’s tournament, which were performed using win probability predictions from our models. Note that play-in game teams are subject to change and are denoted with an *. Continue reading Tournament Simulation | March Madness 2019
2018 NFL Game Predictions
The following table contains our spread and total predictions for each NFL game. We will update this post with new predictions/matchups each week and keep track of how our models perform against the closing Vegas lines for each game. Our models are built using a combination of variables, including our Elo Ratings, Vegas spreads/totals, situational factors, team statistics (from a team’s last 7 games played), historical QB rating of the starting QBs, and more. Our predictions are generated as a composite (i.e., the average of multiple models). We are working on a more detailed write up on our modeling methodology that we will eventually link in here.
Continue reading 2018 NFL Game Predictions
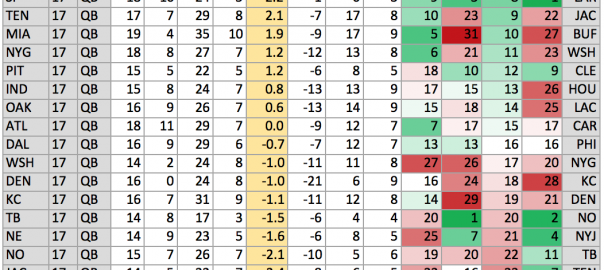
Fantasy Points Above Expectation (FPAE)
Fantasy Points Above Expectation (FPAE) is a metric we created to better capture how much fantasy production each team is giving up. FPAE measures how many fantasy points a team gives up to each position relative to what their opponents had averaged going into each matchup. For example, if GB’s FPAE against QBs is 5.0, that means they have given up an average of 5 points more than expected to QBs. In this context, “expected” is referring to their opponents’ average fantasy points heading into the matchup. We give a detailed explanation of FPAE here. FPAE values for each position group are shown below and were calculated using each team’s last 7 games (PPR scoring).
Continue reading Fantasy Points Above Expectation (FPAE)
2018 Fantasy Football Rankings
FOOTBALL IS FINALLY BACK! And since there is such a shortage of Fantasy Football content out there, we thought we needed to give the people some material to prepare for their drafts. The following rankings are loosely based on model predictions for each position, which use historical player/team data to predict fantasy points for the coming season (i.e., separate models for QB, RB, WR, TE, K, DST). That said, there are plenty of factors that any model will have trouble capturing perfectly (injury status, team depth charts, suspensions, QB/Coach changes, etc.), and thus we have made some subjective adjustments to the rankings where necessary. For example, if a model weighs last year’s cumulative statistics too heavily, Odell Beckham Jr. is not going to come out very high since he only played 4 games. Our rankings can be found below, along with a short description of the model we used for each position. All rankings reflect PPR scoring.
To download our rankings, click here Continue reading 2018 Fantasy Football Rankings
My Model Monday: NFL Coaches Exceeding Win Totals
Every year in the barren wasteland of the NFL offseason, pre-season win totals are set by oddsmakers for each team, serving as a rough expectation for how many games a given team will win in the coming season (e.g., the New England Patriots currently have a win total of 11 for 2018). I took a look at how coaches have performed against those pre-season expectations, with the idea being that a “successful” season is one in which they exceeded their expected wins. As an example, the 2017 Los Angeles Rams had a pre-season win total of 6, but ended up winning 11 games, so that gives a +5 mark for 1st-year head coach Sean McVay. For coaches with multiple seasons under their belt, we can do that calculation for every season and roll-up the results to give a view of how a given coach has performed against expectations over a long period of time.
Continue reading My Model Monday: NFL Coaches Exceeding Win Totals