It seems like every four years when the Winter Olympics come around, curling has a moment. This year’s Pyeongchang games are no different. Curling gets a ton of love online, for reasons both ironic (its shuffleboard-on-ice aesthetic and inherent meme-ability) and non-ironic (its simple-enough rules and interesting strategy). Sure it’s a little goofy, but if you’ve found yourself getting into the sport within the past week or so, you’re not alone.
I’ve been drawn to the sport for a while for all the reasons above. Dig deep enough through my Facebook likes, and you’ll find one for a page dedicated to the Norwegian Men’s colorful pants, circa Vancouver 2010. This year, though, I took interest in it for a different reason: I began to wonder if curling could be an opportunity for Model 284 to break new analytical ground. Maybe we could make some fresh data-driven tracks in a sport no one has explored before. Surely no one would have put in the time for something that niche, right?
Wrong.
A Google search for curling analytics turns up such results as an Analytics page on CurlingZone.com and an article in The Globe and Mail titled, “Data analytics sweeps into the curling arena”. This analytical ground has already been broken. There is nothing new under the sun.
Nonetheless, we shouldn’t let that spoil our fun! I decided to explore the historical Olympic curling data, and along the way, I ended up building a win probability model.
Data
In curling, teams take turns sliding stones down the ice toward a target. Once both teams slide all of their stones, the team with a stone closest to the center gains points based on how many of their stones ended up closer than their opponent’s closest stone. This is one “end”, and one game of curling is made up of ten of these (or more sudden-death style, in the event of a tie). In each end, it’s a big advantage to throw last, as you have the last shot to knock your opponents out of position. This is called the hammer.
This end-level information is the data I have. I have the score for each end of each Olympic curling game (men and women) since curling became an official sport in Nagano in 1998. (I didn’t use the data from this year’s mixed doubles competition.) If I had my way, I’d have shot-level tracking data rather than end-level data, but there was none to be found.
I scraped this information from Wikipedia using R. After I finished, I realized I had missed a huge opportunity: I used the scraping package “rvest” when R has another scraping package named “curl”. Alas.
Building a Win Probability Model
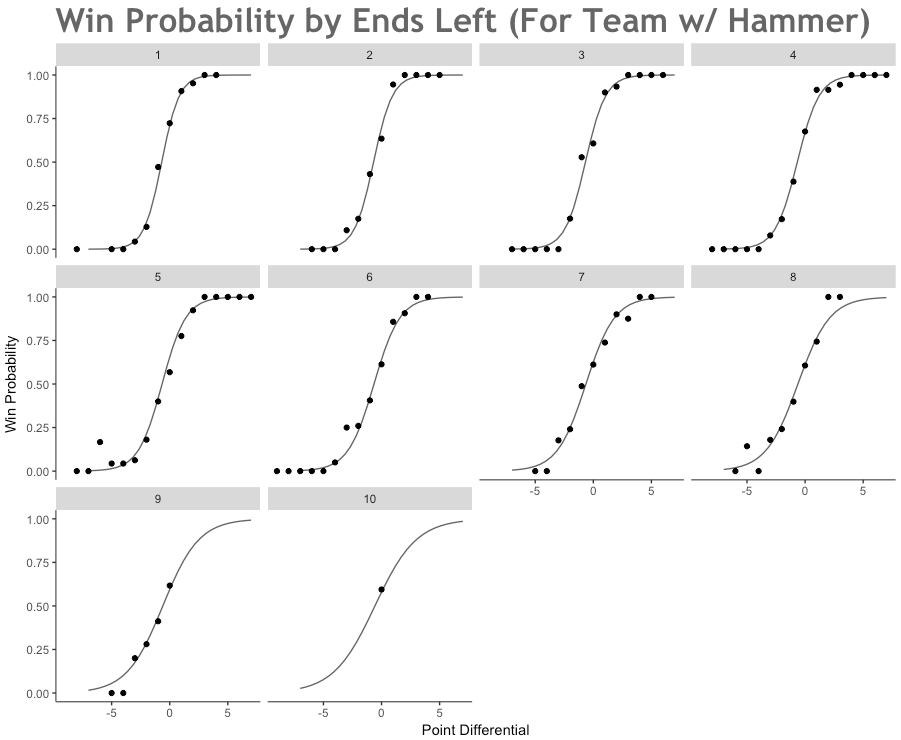
I formatted the data such that each row corresponded to the game state before one end of one game. This is what I fed into my model. The independent variables were number of ends left in the game and the score differential (hammer team’s points minus other team’s points). The dependent variable was whether the team with the hammer that round won the game. I used these to build a basic logistic regression model to predict win probability based on game state. It looks like this model tracks pretty closely with observed win probabilities for each state.
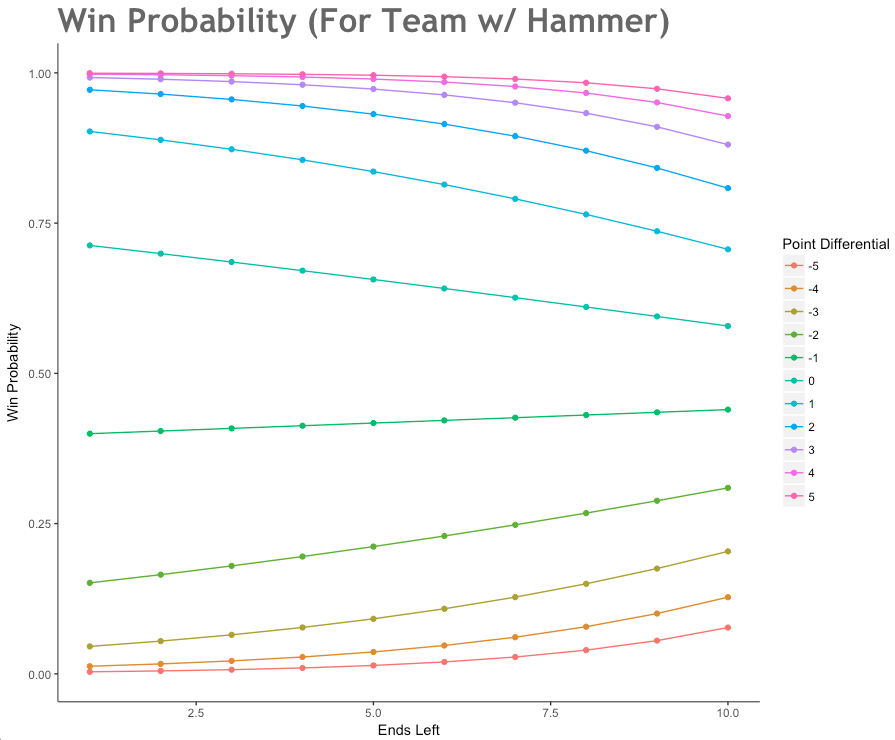
Interestingly, the effect of ends left is a lot weaker than I would have thought. The plot below shows that a lead is a lead, and how late or early it is in the game doesn’t effect the value of the lead too drastically.
Most Exciting Games from Pyeongchang
Let’s take the model out for a spin by finding the games from these Olympics so far where the win probability has fluctuated the most. In theory, these should be the most exciting.
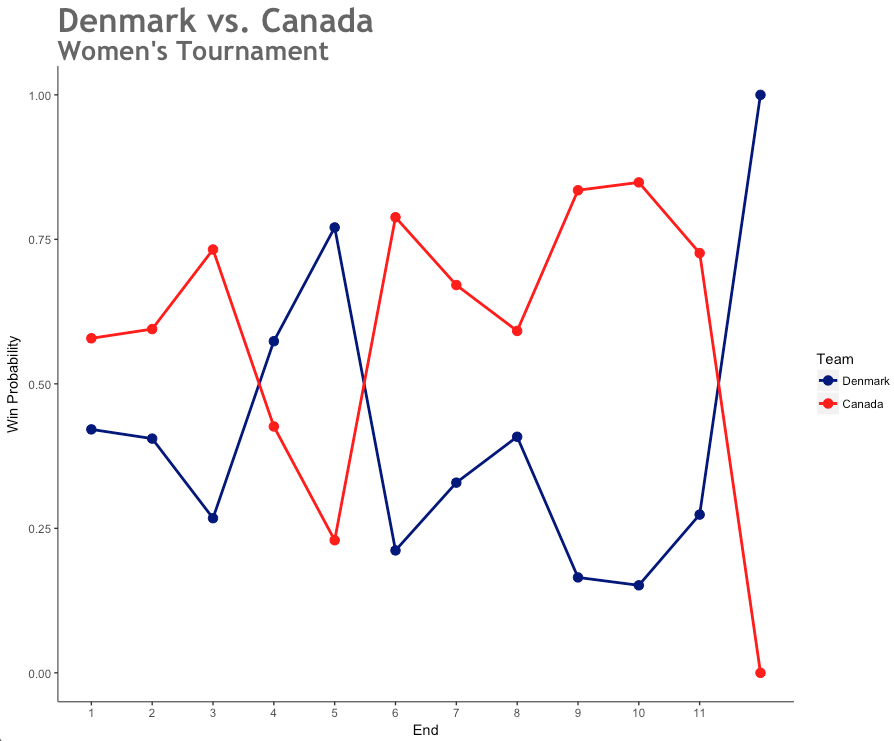
Denmark vs. Canada (Women’s Tournament)
The game with the most win-probability fluctuation was Denmark vs. Canada in the Women’s tournament. This game featured a lot of lead changes. Canada was up 2-0, then Denmark 4-2, then Canada 6-4. Denmark tied it up at 6 only to see Canada tack on two more, but the Danes came back to tie it up in the tenth end. Canada had the hammer advantage in overtime, but Denmark scored one anyway to clinch the victory.
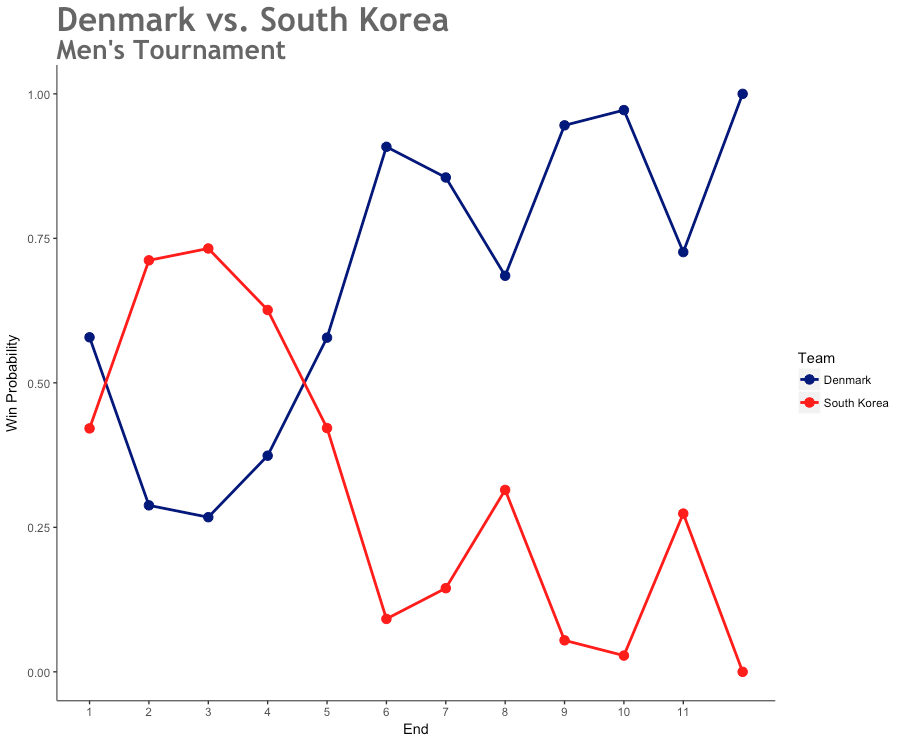
Denmark vs. South Korea (Men’s Tournament)
Denmark also featured in the next-most exciting game, this time versus South Korea in the Men’s bracket. South Korea jumped out to a 2-0 lead, lost it, then erased an 8-5 deficit in the last two ends, but Denmark claimed victory in overtime with the help of the hammer.
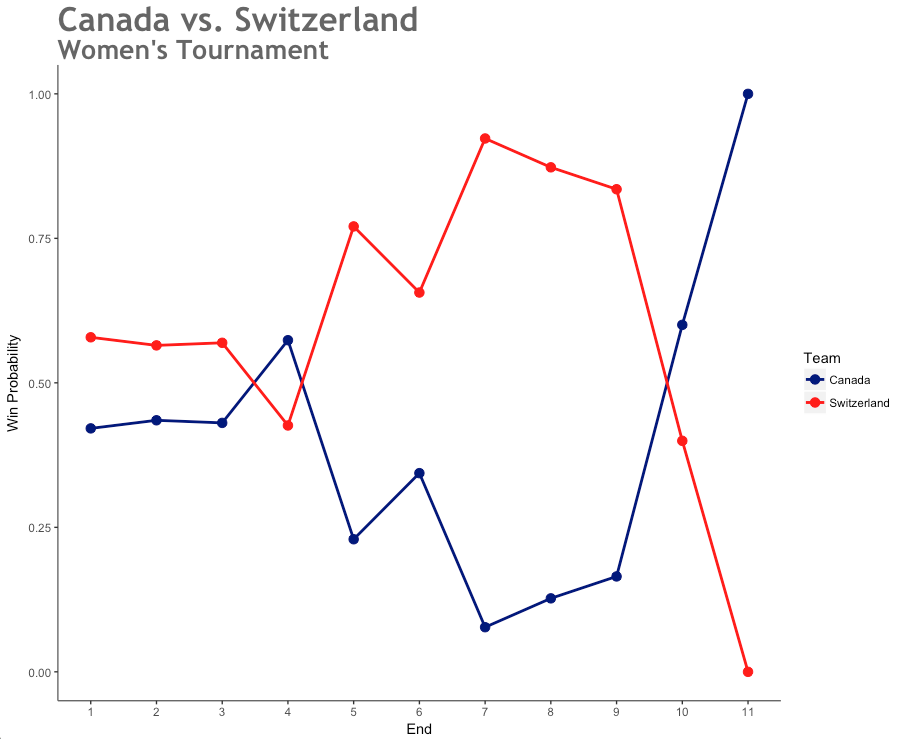
Canada vs. Switzerland (Women’s Tournament)
The Canadian women also featured in the third-most exciting game. This time they had a better result. The Canadians were down 8-6 after eight ends, but scored three in the ninth end and stole one in the tenth to claim victory.
I hope the rest of the curling tournaments produce as much excitement as these games!