I can’t recall where I first heard it, but my favorite fantasy draft quote is “you can’t win your league with your first pick, but you can lose it.” Drafting a stud in the 1st round does not guarantee a championship. In most cases, the league champ hit on a sleeper in the later rounds and picked up important pieces on the waiver wire. On the other hand, when your 1st round pick is a complete bust, it can be a crippling blow. This is why I have always prioritized safe, conservative picks in the 1st round over players who might carry more risk. In the article below, I examine the fantasy football value and risk between quarterbacks, running backs, and wide receivers using preseason rankings from ESPN.com and season-long scoring totals from pro-football-reference.com.
Preseason Rankings vs. Total Points Scored
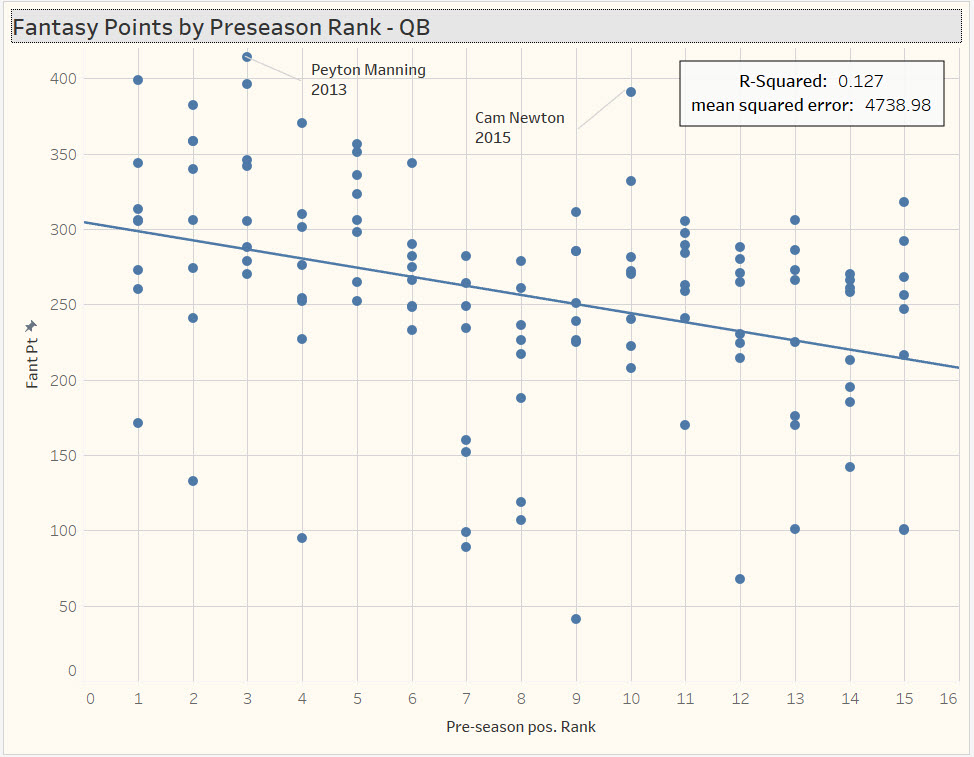
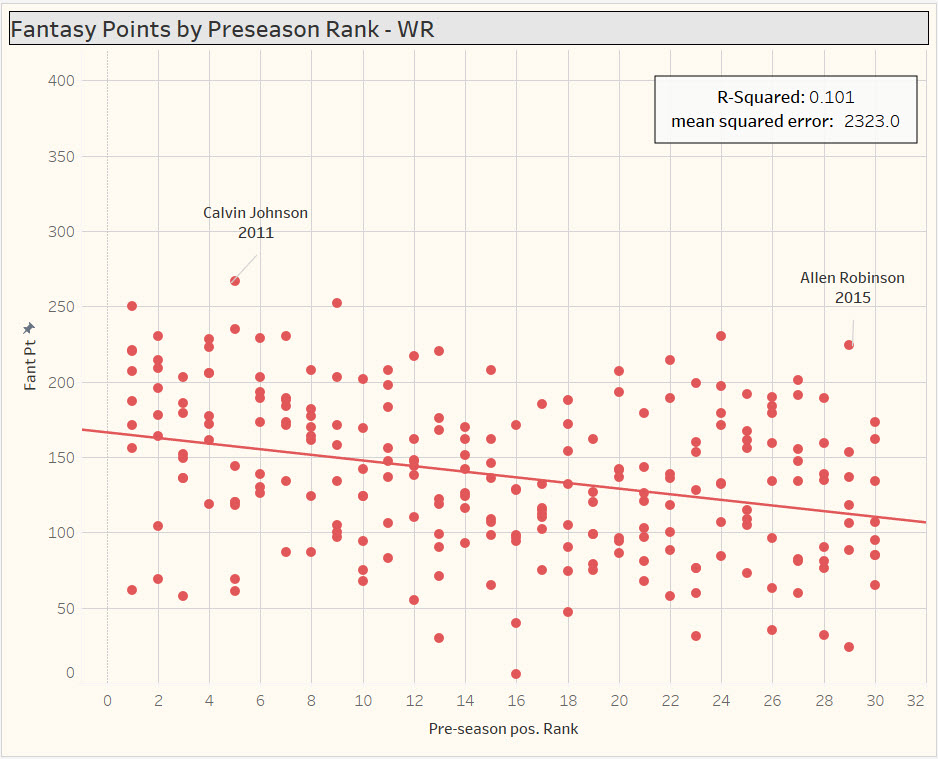
Obviously, no one knows what a player’s end-of-season rank will be on draft day. During the preseason we think we have a good understanding of who the best players will be from the endless supply of projections and rankings available for consumption. This raises the question: how closely do actual fantasy points scored align with our expectations before the season starts? Or, more simply, are preseason rankings accurate? And does that vary by position?The following charts display fantasy points scored by the player’s preseason rank (within their position) from ESPN.com (2009-2016):
Quarterbacks
Wide Receivers
Running Backs
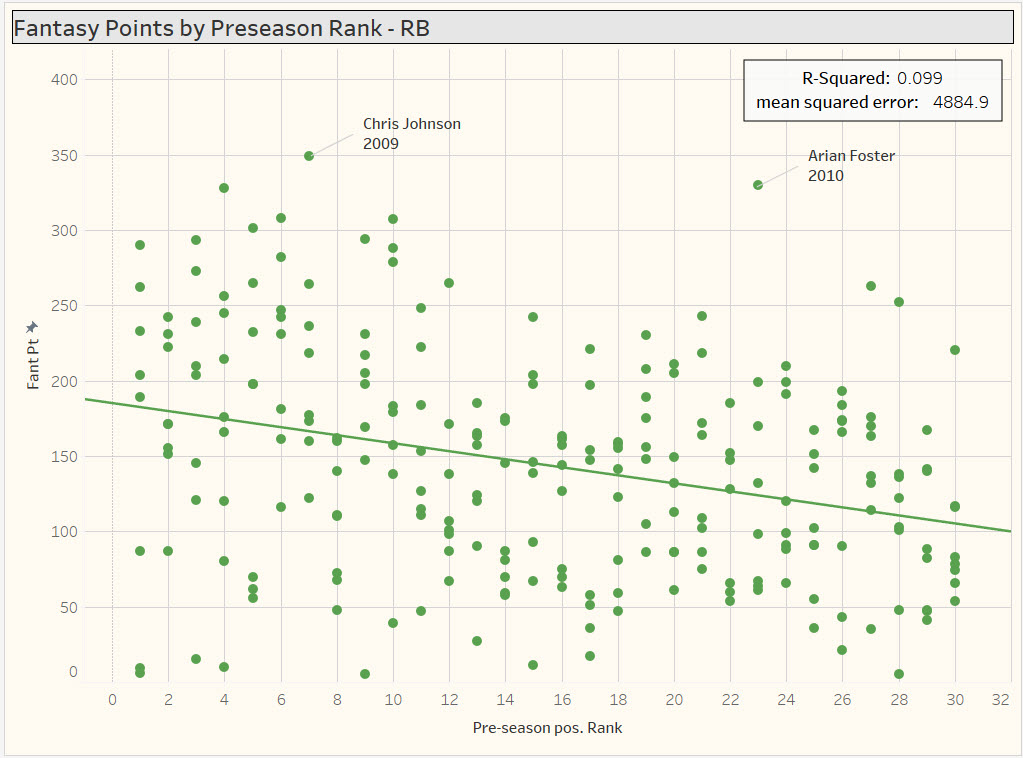
All three plots show a trend of decreasing fantasy point totals as rank increases, just as we would expect. There is also a wide distribution of fantasy points within each rank, with plenty of players falling on the high and low ends of the trend line. Now, look at the difference in the spread of the data points in the three plots. It appears that the data points for RBs are more scattered across the y axis. The R-squared value for the relationship between points scored and preseason rank is lower for RBs (0.099) than for WRs (0.101) and QBs (0.127), suggesting that preseason rank explains less of the variation in fantasy scores for RBs than it does for QBs or WRs. This means that there is generally a wider range of outcomes of points scored for similarly ranked RBs than for QBs and WRs, or that RBs are a more risky investment.
Taking a slightly different view, next we examine how often players finish in the top 10 at their position and compare those rates against preseason rankings. We would expect top ranked players in the preseason to finish in the top ten at a higher frequency than late round players. The chart below shows all players since 2009 grouped by their preseason ranking (in buckets of three). The height of each bar represents the percentage of those players who finished in the top 10 in their position:
![]()
Since 2009, players ranked in the top three at their position have finished in the top ten at a rate of 79% for quarterbacks, 59% for wide receivers, and just 50% for running backs. Next time you get excited about drafting a top running back, remember that for the past 8 years it has been a coin flip on whether a top three ranked running back even finishes in the top ten at their position! For players ranked 4-6 these percentages become closer: 62% for QBs, 54% for WRs and 52% for RBs.
Clearly, the top ranked quarterbacks have the highest percent of finishing in the top ten in their position. However, it is important to remember that there are fewer starting QBs in the NFL than RBs and WRs, and thus a top 10 QBs is a less exclusive group. Also, in standard leagues each fantasy team only plays 1 quarterback vs. 2-3 for wide receivers and running backs which means that top ten quarterbacks are also easier to acquire. This brings us to the issue of cross-positional comparisons (e.g., comparing a top QB to a top RB).
Positional Value
If position was irrelevant and all that mattered was scoring the most points, QBs would be the first players off the draft board every year. However, roster construction and positional depth make things less “apples-to-apples” when comparing across positions in fantasy football. As a first step, let’s look at how the top scorers vary at each position. The chart below shows the average fantasy points per game by final position rank from 2009 to 2016. On average, the difference between the top RB and the 10th RB is 7.3 points per game, a larger gap than QB (6.6), and WR (3.8). Via the graph below, it is clear that RBs (green dots) form a steeper slope than both the QBs (blue dots) or WRs (red dots). This shows how shallow the top tier of RBs has been. As NFL teams have trended more and more towards the passing game in recent years, elite bell-cow RBs have become more rare and thus more valuable in fantasy football.
![]()
A metric that can make cross-positional comparisons easier is Value Based Drafting (VBD) which views each player not by their fantasy point total, but rather by how much better/worse that point total is compared to an average player at the same position. The baseline player being used for this analysis is the 12th ranked QB, the 24th ranked RB and the 30th ranked WR. Note that VBD is never negative (if a player scores less than the baseline player, his VBD is 0). VBD is often used as a drafting tool to project a player’s value for the coming season, but here we are using it retrospectively to assess each player’s actual value from prior seasons. This metric is effective because it quantifies how many points that a player added to your team over a baseline (or replacement-level) player at that position, accounting for the fact that there are differences between, say, a replacement-level QB and a replacement-level RB. The chart below shows end-of-season VBD by preseason position rank for RBs and WRs.
![]()
Overall, The top ranked running backs tend to have a higher VBD than the top ranked wide receivers and quarterbacks. It is also clear that The RB trend line is also steeper than the WR trend line, suggesting that there is a larger drop off in production for running backs than for wide receivers. This all supports the notion that highly ranked RBs have delivered more value than highly ranked WRs and QBs.
Conclusion and Application in 2017
Last year, I decided that wide receivers were safer picks than RBs because of their longer primes and lower injury rate. In all but one of my leagues, I used my first pick on a WR and passed on Ezekiel Elliott, David Johnson, and Le’Veon Bell. As you might expect, that did not play out well. Those RBs finishing as the top fantasy producers in 2016 has led to them being selected first in 2017 drafts. However, just one season earlier, we saw nearly all of the 1st round RBs disappoint either due to injury (Le’Veon Bell, Jamaal Charles, Marshawn Lynch) or simply poor production (Fat Eddie Lacy, C.J. Anderson, DeMarco Murray). Which scenario is most likely to play out in 2017?
The data highlighted above agree this year’s top RBs are the most valuable commodities (Johnson, Bell, Elliott), but also suggests it is very likely one of them doesn’t even finish as a top ten RB. Given these three are still young, should remain the centerpieces of their offenses, and have proven they can put up elite production if they can stay on the field, it is tough to argue with them as top fantasy selections, even given the risk. Overall, WRs have proved safer investments in the long run, though the difference is not as drastic as you might expect. In years without a clear cut top tier of RBs, taking a consistent star receiver like Antonio Brown in the 1st round may be a smart choice, but refusing to take a top RB early because of the risk alone means sacrificing top-tier upside.
2 thoughts on “Fantasy Football Value and Risk by Position”
Comments are closed.