Every July since 2004, a couple hundred NBA hopefuls have gathered in Orlando, Utah, and Las Vegas to compete in 5-6 junk ball basketball games known as the Summer League. Whether you’re an NBA operations analyst or just a fan, NBA Summer League provides another opportunity to see a player—or in our case, another data point to project a player. But how much should we really take away from a few junk ball games in the beginning of July? Or, in “statistical” terms, what is the predictive value of summer league for a player’s actual NBA Performance? This analysis seeks to provide insights into how historical Summer League performances have related to NBA performances. More specifically, we’ll seek an answer to questions such as: how much can NBA Summer League performance tell us about overall rookie performance? How about second-year returning players? What should we take away, if anything, from these varying levels of performance in Summer League? In this article, I will focus solely on NBA rookies, providing meaningful data points and inferences about which statistics best translate from Summer League to NBA Rookie Season.
Data
In order to access the value of NBA Summer League in projecting NBA Performance, I used RealGM’s historical Summer League data from 2004-2016 and Basketball Reference data for NBA Statistics for players that participated in Summer League during that time period. Obviously, not all players participate in Summer League, and players participate to varying degrees—high draft picks sometimes only play a couple of games—so yes, this is a small and limited sample of data, but a sample nonetheless.
Which Statistics Translate?
First in the exploration process, I looked at correlations between Summer League basic box score statistics and NBA Rookie Season basic box score statistics. This exercise only includes rookies that played more than 50 minutes of Summer League ball. To get started, here is a basic comparison between players’ points per game in Summer League vs. points per game in their NBA Rookie Season. Note that as you hover over points, players’ names and values should appear.
We see a positive, somewhat strong relationship between points per game in Summer League vs. the NBA. Moving along, below is a correlation matrix between per-game box score statistics for NBA Summer League vs. NBA Rookie Season. Correlation is a measure of linearity, ranging from -1 to +1, where +1 is a positive perfect linear relationship between two variables and -1 a negative perfect linear relationship between two variables. A correlation of 0 would represent no linear relationship at all between two variables; meaning there is no relationship, positive or negative, between two variables.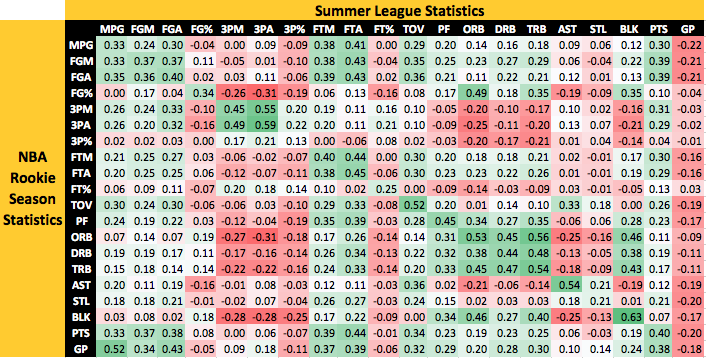 There are 400 correlated variables in this matrix, which is a lot of information to digest. There are endless amounts of relationships to be explored, but I will try to keep it short for now. The most highly correlated set of variables is Summer League Blocks and NBA Blocks (0.63). Next, total rebounds show a relatively high correlation, at 0.54. Interestingly, the number of summer league games played and all NBA Rookie Season Statistics are negatively correlated, highlighting the idea that top draft picks usually don’t play all 5 or 6 games in summer league. Total rebounds and blocks are statistics that inherently vary by position. In order to reduce that noise across positions, I have broken out the correlation matrix into the three position groups we used in our Similarity Score Algorithm: Guards (Primary Ball Handlers), Wings, and Bigs.
Guards (Ball Handlers)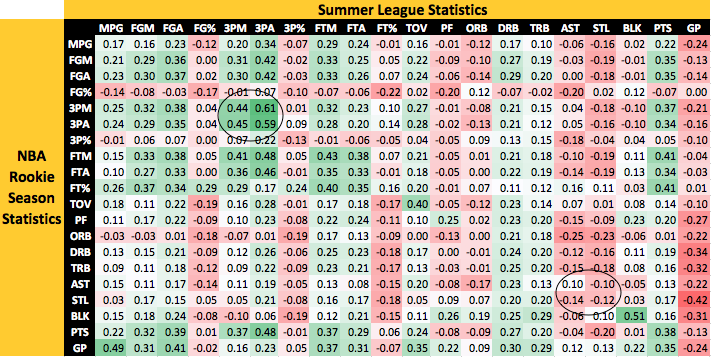
For guards (ball handlers), I have circled distinct areas of interest: three pointers and assists/steals. Guards that shoot threes in summer league, whether efficient or not, are also going to shoot them as NBA rookies, while high assist and steal marks don’t necessarily translate as well to NBA rookie season performance. Summer league offers less structure and more so-called junk ball, therefore steals and assists are flukier than in real NBA games.
Wings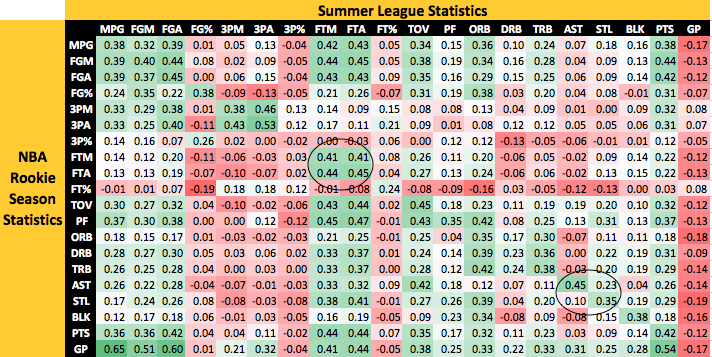
Wings generally contribute more uniformly across a box score compared to big men and guards. Notably, there is a much stronger positive correlation between assists and steals for summer league and NBA Rookie Season performance compared to guards, so those five steals for Jayson Tatum appear to be a good sign. Next, getting to the free throw line is another trait that appears to translate, in addition to three point shooting volume.
Bigs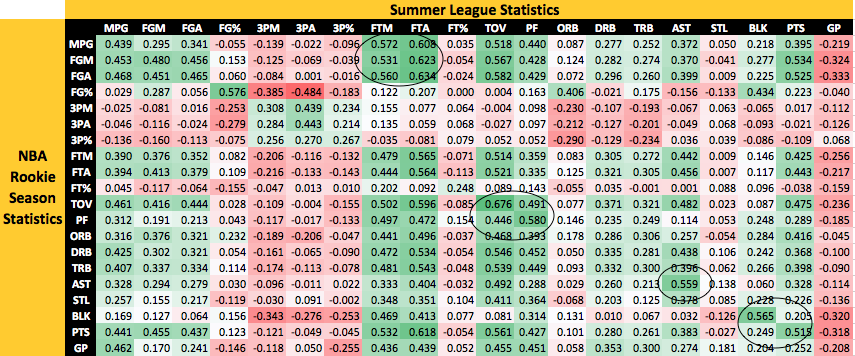
At last, we reach the big men. Bigs have some interesting correlations going on. First and foremost, the extremely high positive correlation between Summer League FTM/FTA and TOV/PF and most NBA Rookie Season Statistics is staggering. Some of this can likely be explained by the extreme differences in types of bigs. For instance, some bigs, such as Joakim Noah or Karl-Anthony Towns, pass and touch the ball a lot more than bigs like DeAndre Jordan, who simply dunks the ball. In short, bigs that show potential in playmaking, blocking shots, and getting to the line should be able to translate that to the NBA.
Projecting NBA Rookie Season Performance
We’ve explored correlations and relationships of simple box score statistics from Summer League to NBA Rookie Season performance. But how much predictive power does NBA Summer League have on overall rookie performance? In order to capture NBA rookie season performance, we used a metric called Win Shares (though other all-encompassing metrics such as Value Over Replacement Player, Box Plus Minus, Real Plus Minus, and more were also explored). Win Shares is a player statistic that attempts to divvy up credit for team success to the individuals on the team. Win shares can technically be any value positive or negative, and a negative value would mean a player was so poor he essentially took away wins from his team. For more info on the calculation of Win Shares, see this breakdown. Here is an example of the top 5 Win Shares from 2015 NBA Rookies, to give us a better idea of what the Win Shares metric looks like:
| Player | Win Shares |
| Karl-Anthony Towns | 8.3 |
| Kristaps Porzingis | 4.3 |
| Willie Cauley-Stein | 3.8 |
| Willy Hernangomez | 3.4 |
| Frank Kaminsky | 3.3 |
Now, using Win Shares as the response variable, I built a simple multiple linear regression model to explore how much variance in Win Shares can be explained by NBA Summer League Performance. After adjusting for minutes, the following predictive variables were used: Total Rebounds (TRB), Field Goal Attempts (FGA), Free Throw Attempts (FTA), Three Point Attempts (X3PA), Assists (AST), Steals (STL), Blocks (BLK), Turnovers (TOV), and Personal Fouls (PF). Note that each player’s numbers were standardized by position prior to fitting the model. The table below shows the coefficient for each variable in the regression model:
| INTERCEPT | TRB | FGA | FTA | X3PA | AST | STL | BLK | TOV | PF |
| 0.54 | 0.06 | 0.25 | 0.28 | 0.07 | 0.19 | -0.05 | -0.01 | -0.02 | 0.01 |
One measure of so-called predictive power is adjusted R-squared. First off, R-squared, also known as the coefficient of determination, is the proportion of variance in the dependent variable (Win Shares) that is explained by the predictive variables (box score stats). Adjusted R-squared takes into account the number of independent variables included. In this case, our “simple” model explained roughly 10.9% of the variance in rookie win shares from the aforementioned Summer League statistics, which is not particularly high.
In the final model, I explored a number of ratios and interactions, ultimately settling on two interactions between Field Goal Attempts and Free Throw Attempts as well as Assists and Turnovers (in addition to our previously included variables). This final model showed Summer League performance explaining 15.5% of the variance in Rookie Win Shares. While this isn’t astronomically high, it does show there is some predictive power in Summer League on NBA Rookie performance.
| INTERCEPT | TRB | FGA | FTA | X3PA | AST | STL | BLK | TOV | PF | FGA:FTA | AST:TOV |
| 0.37 | 0 .07 | 0.19 | 0.15 | 0.11 | 0.08 | -0.02 | 0.01 | -0.08 | 0.03 | 0.27 | 0.19 |
What do we make of the coefficients? Why is steals a negative coefficient and personal fouls a positive coefficient? First and foremost when dealing with multiple variables in a regression model, it is important to understand that in interpreting a single coefficient you are assuming all other coefficients are constant. Other reasons for these intuitive coefficients include covariance between some predictors and the fact that steals were a weakly correlated variable between summer league and the NBA. Finally, given the personal foul max is 10, personal fouls are likely some function of minutes played in summer league, since you essentially cannot foul out.
Out-of-Sample Predictions
Now let’s have a little fun and make some out-of-sample predictions. The idea of out-of-sample predictions stems from the concept of cross validation, which is the process of removing a sample of data, known as the testing dataset, and then training your model on the remaining data, the training dataset. Finally, we use the trained model to make predictions on the test data. In this case, I removed a single player from the dataset to test on and trained on the remaining players in the data. Below are the top 10 predicted Rookie Win Shares:
| Player | Predicted Rookie Win Shares | Actual Rookie Win Shares |
| Thomas Robinson | 4.82 | -0.1 |
| Damian Lillard | 2.66 | 5.8 |
| C.J. McCollum | 2.62 | 0.2 |
| Jaylen Brown | 2.55 | 1.5 |
| Doug McDermott | 2.36 | 0.0 |
| Blake Griffin | 2.21 | 9.8 |
| Karl-Anthony Towns | 2.13 | 8.3 |
| Gary Harris | 1.90 | -0.7 |
| Montrezl Harrell | 1.86 | 0.9 |
| Jabari Parker | 1.80 | 1.3 |
While we can certainly spend more time building a “better” predictive model using various variable selection techniques and machine learning algorithms, the point of this exercise was less about prediction and more about understanding the relationship between summer league performance and NBA Rookie Season performance. Sometimes the simplest models are the most effective in that they provide easier interpretation.
Conclusion
NBA Summer League games provide another opportunity for teams (and fans) to get a glimpse of NBA prospects. There are certain statistics that should be keyed into when watching NBA summer league games. For instance, scoring (whether efficient or inefficient), playmaking skills (especially for bigs and wings), and the ability to get to the free throw line translate well to an NBA Rookie Season. And while 3-point shooting percentage doesn’t translate well (at least in our extremely small sample), players that attempt more 3s in summer league should continue that into their NBA Rookie Season. Furthermore, steals have a relatively weak relationship from Summer League to the NBA. With all of that, you should expect to see your prized top rookie perform well in summer league, but it is not the end all be all. At the same time, be sure to cool your jets on those 27 point, 3 steal junk ball performances (i.e. Kris Dunn in 2016).