In my first ever My Model Monday, I wanted to get back to my roots: ice hockey and St. Olaf College. For those who don’t know, I used to play ice hockey (sometimes) and did so at St. Olaf College; therefore, I figured it would be fun to bring some analysis to a sport and level that is rarely covered: Division III Men’s Ice Hockey.
There is an infinite number of ways to rank teams, but given the lack of credibility of the data available for DIII hockey, I wanted to keep things simple, which led me to FiveThirtyEight’s favorite ranking metric: Elo ratings. Here at Model 284, we are fans of Elo ratings as they are a relatively simple way to measure performance over time. For those unfamiliar with Elo ratings, I’d suggest reading our full explanation in NFL Elo Ratings Methodology. As a quick primer, Elo ratings, originally designed for the game of chess, seek to quantify the relative skill level of players or teams. Elo Rating systems start with every team starting at the same score (typically 1500). Then, as teams play each other, their scores adjust based on the Elo rating of the opponent and margin of victory (or loss). Elo ratings have been popular in soccer and (American) football to create rating systems. They haven’t been as popular in the hockey world, although at Model 284 we do have NHL Elo Ratings tracking team performance throughout the NHL season.
Using USCHO.com, I scraped Men’s DIII Ice Hockey data dating back to 2000. Therefore, in the 2000-2001 season, all teams and schools started with an Elo rating of 1500. Following each season, I regressed a school’s Elo Rating to the mean (1500) by 30% in order to account for roster turnover and program changes. Now, applying the formula and methodology outlined above, we can track Elo ratings for DIII Men’s Hockey programs over the last 18 seasons. This will provide a good approximation for how good a team is at any given point in time, giving us insights into a program’s historical peaks and valleys.
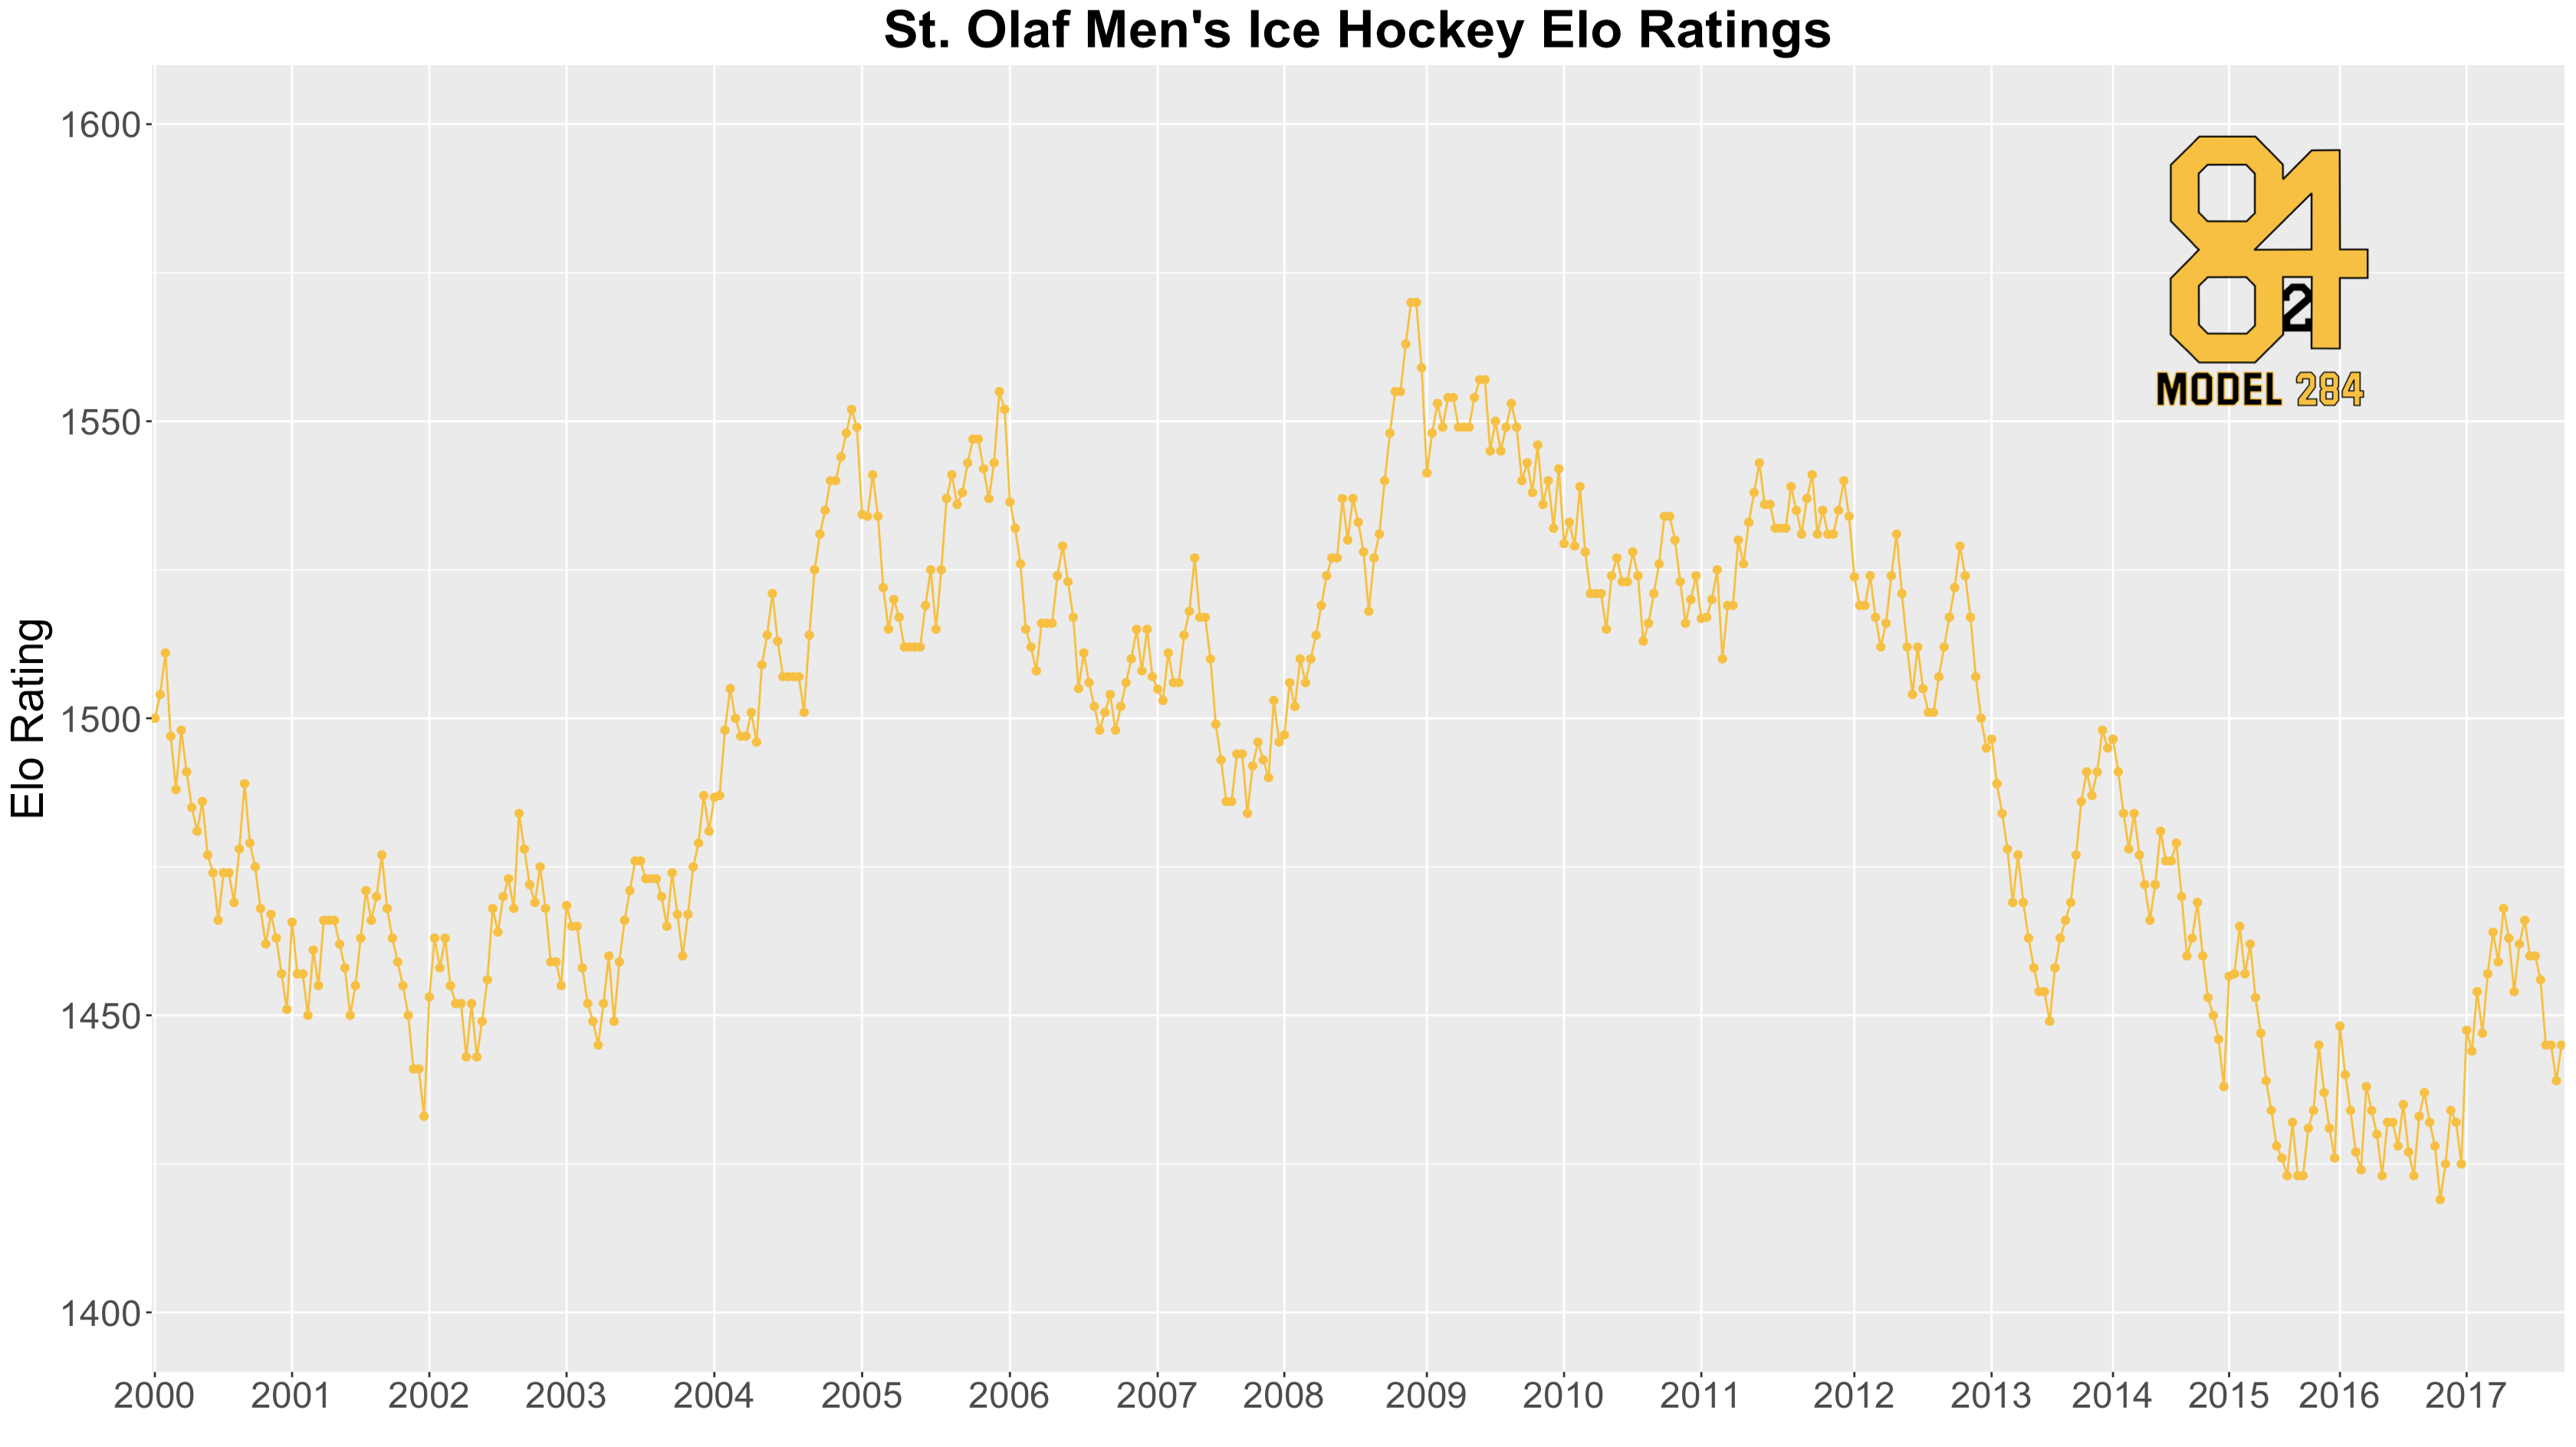
Now, we can ask, who is the best St. Olaf team in history (or at least since 2000)?

Looks like the 2008-2009 Oles are the best team in recent memory. The 2008-2009 Oles went 12-1-3 in the MIAC and were led by Isak Tranvik, Dylan Mueller, Roger Trousdale, and Sam Windsor. Also, it’s noticeable that there has been a steady decline in the program since 2013-2014. But there appears to be some hope for a turnaround, as the 2016-2017 Mike Eaves- and Lee Goren-led Oles have at least flattened the trend to a degree.
This Season
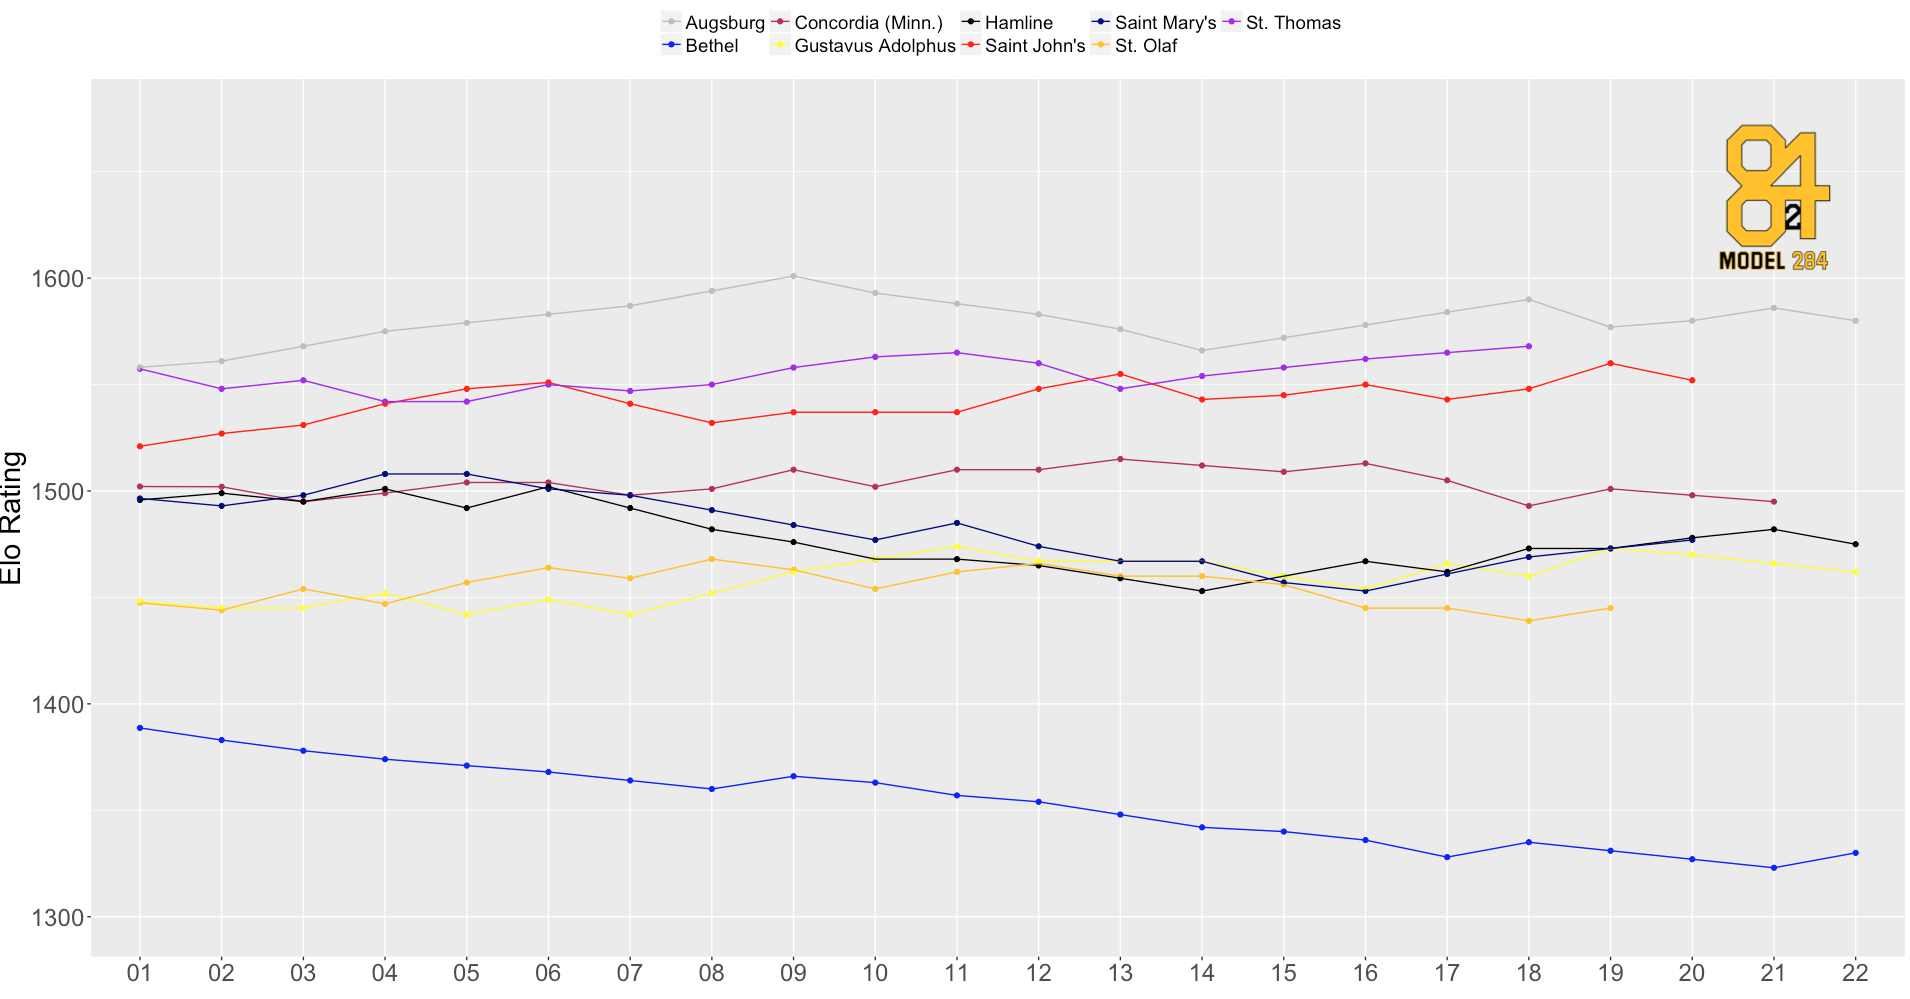
How have the 2017-2018 Oles looked relative to the rest of their conference, the MIAC? The plot below displays each MIAC team’s Elo rating over the course of the season:
There are clearly three classes of teams in the MIAC, and the Oles fall in the bottom of a middle tier that consists of Hamline, Saint Mary’s, Gustavus, and Concordia Moorhead. The top tier of Saint John’s, St. Thomas and Augsburg are the clear-cut best teams in the MIAC, and a safe bet to make it out of the playoffs this year. Bethel is in a league of their own. Historically, Bethel has been far and away the worst team in the MIAC the last few seasons.
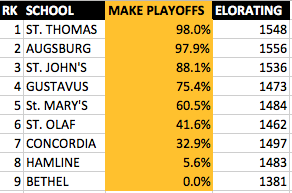
So, what do the Oles’ playoff odds look like? Well, we can figure this out by creating a Monte Carlo simulation for DIII Men’s ice hockey based on Elo ratings up to this point. We ran 10,000 simulations and came up with the following probabilities:

The Oles are just on the outside looking in. Although they are sixth in terms of probability to make the playoffs, they actually have the 8th worst Elo rating in the MIAC, which suggests they are currently overperforming their rating. This could be because of an easier schedule to this point, or due to winning by mostly small margins. Or, maybe that is a sign of great coaching? Maybe not, but if the Oles are going to make the playoffs, they will have to rely heavily on captain and lead goal scorer Drew Otto and their solid but small defensemen Judd Loewenstein and Tuukka Totro.
On another note, one has to wonder when Head Coach Mike Eaves and Assistant Coach Lee Goren are going to give us at Model 284 a chance to put in our 50 hours a week of volunteer work for the St. Olaf Men’s Hockey program. We will be patiently waiting for the call.
Going forward, I will continue to update MIAC Hockey Power Rankings and Playoff Probabilities each week until the bitter end of the MIAC season. Be sure to tune in as the playoffs gear up, and expect some more future work involving our analysis on the impact of St. Olaf Men’s Hockey on St. Olaf Women’s basketball games!
2 thoughts on “My Model Monday: DIII Men’s MIAC Hockey Rankings”
Comments are closed.