The article below shows how our models view this year’s tournament field from a simulation perspective. Each table shows the % chance that each team advances to a given round of the tournament (e.g., in the first table, Gonzaga has a 92.5% chance of advancing to the 2nd round). These figures are calculated based on 5,000 simulations of this year’s tournament, which were performed using win probability and spread predictions from our models. See our related posts for our Full 2022 Tournament Bracket and our Game-by-Game Predictions.
Tournament simulations are an awesome tool that can be used to account for all the potential matchups that teams could face on their way to cutting down the nets. They are extremely useful for comparing “what is most likely to happen” against public picks to find optimal places to differentiate your bracket from others in your pool. They also do a great job of highlighting how difficult it is to make a run in this tournament – even the teams that are most likely to get to the Final Four usually have less than a 50% chance of doing so (i.e., it is more likely that they DO NOT make the Final Four).
West Region
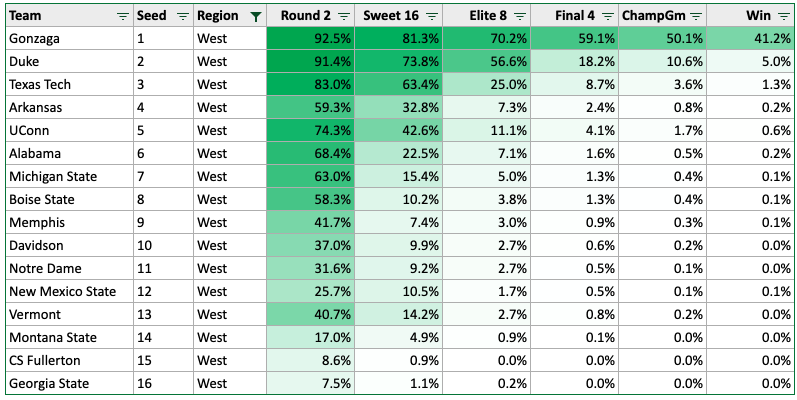
We again show Gonzaga (59%) as the overwhelming favorite to come out of the West region this year. Duke (18%) and Texas Tech (9%) are strong teams, but both measure well below Gonzaga in our analysis. Using ESPN’s public bracket data, the public Final Four picks align very closely with the percentages above for Gonzaga/Duke/Texas Tech, so none of those teams are a good “value” pick. Using anyone other than Gonzaga will be a quick way to have a contrarian bracket if you are in a large pool. In terms of upsets, Vermont (41% to beat Arkansas) stands out in this otherwise-chalky region.

East Region
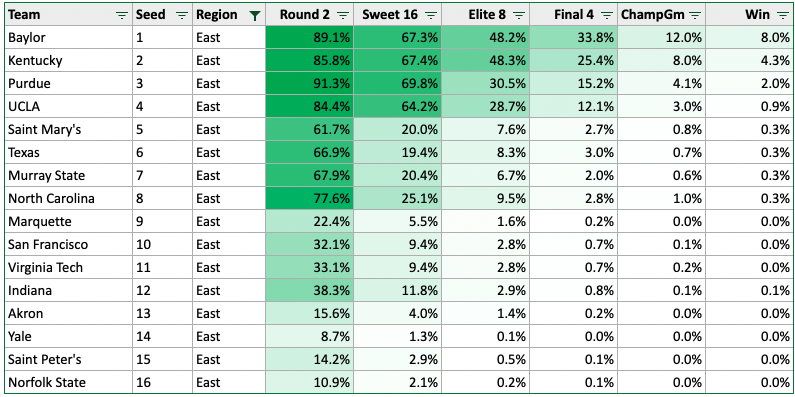
The East looks more competitive, with Baylor (34%) and Kentucky (25%) followed closely by Purdue (15%) and UCLA (12%). There is a big dropoff after those four, so this is probably not a good region to pick a longshot. It should be noted that Baylor may be without two key rotation players (Jonathan Tchatchoua and LJ Cryer).

South Region
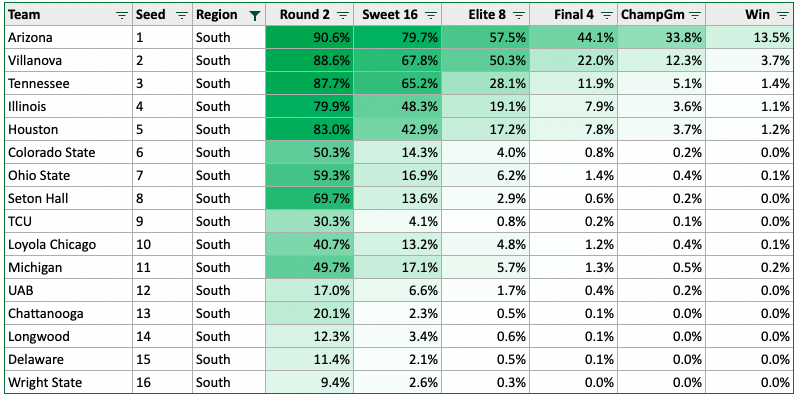
Arizona (44%) is roughly twice as likely as any other team to make the Final Four out of the South. The potential Villanova-Tennessee and Illinois-Houston matchups both figure to be close, and thus dampen the future probabilities for all teams involved (and also helps Arizona). Tennessee (12%) seems overvalued by the public, who is picking them to go to the Final Four 19% of the time. On the other hand, Villanova (22%) looks to be a solid value (public only picking them 16%). The 1st round 6-11 matchup between Colorado State and Michigan is almost exactly 50/50 and figures to be a popular upset pick.

Midwest Region
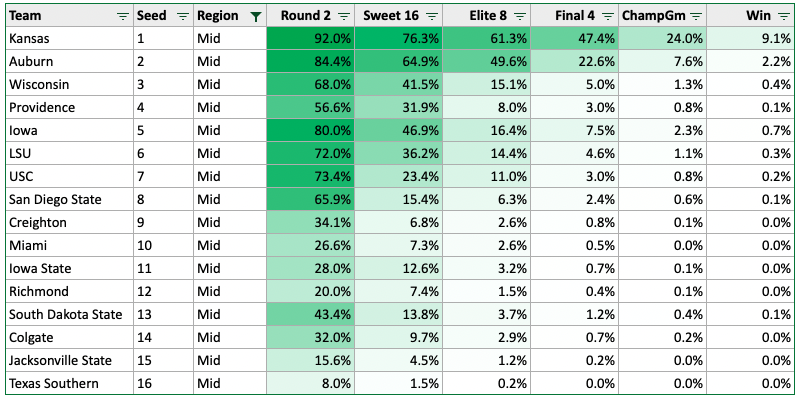
Kansas (47%) and Auburn (23%) stand out above the rest of the Midwest region, with Wisconsin (5%) and Providence (3%) both facing tougher matchups early on. Our numbers give Iowa (7.5%) a good shot at stringing together a few wins, though the public will likely be even higher on them following their Big Ten Tournament title and recent winning streaks.

Tournament Champ
Our numbers see Gonzaga (41%) as the overwhelming favorite to win it all this year (just as we did last year). Since only 28% of the public is picking Gonzaga to win, they are a good value, even though they won’t be a contrarian choice (or, as another data point, Gonzaga’s Vegas title odds are around 22-25% at between +300 to +350 depending on the book). If you’re in a smaller pool, it’s fine to pick Gonzaga as your champion, but, if you’re in a pool with hundreds of people, you will want to go outside the box. Frankly, our numbers are fairly in line with the public picks this year, so there are no obvious (non-Gonzaga) options sticking out. We are a bit higher than the public on Arizona (13.5%) and Kansas (9.1%) if you need a more unique choice. Or, if you want to be very contrarian (or are in a large pool), we show some value on Villanova (3.7%) as a longshot. Here is the full output of our simulation:
| Team | Seed | Quad | Round Two | Sweet 16 | Elite 8 | Final Four | Champ Game | Win |
|---|---|---|---|---|---|---|---|---|
| Gonzaga | 1 | West | 0.925 | 0.813 | 0.702 | 0.591 | 0.501 | 0.412 |
| Arizona | 1 | South | 0.906 | 0.797 | 0.575 | 0.441 | 0.338 | 0.135 |
| Kansas | 1 | Mid | 0.92 | 0.763 | 0.613 | 0.474 | 0.240 | 0.091 |
| Baylor | 1 | East | 0.891 | 0.673 | 0.482 | 0.338 | 0.120 | 0.080 |
| Duke | 2 | West | 0.914 | 0.738 | 0.566 | 0.182 | 0.106 | 0.050 |
| Kentucky | 2 | East | 0.858 | 0.674 | 0.483 | 0.254 | 0.080 | 0.043 |
| Villanova | 2 | South | 0.886 | 0.678 | 0.503 | 0.220 | 0.123 | 0.037 |
| Auburn | 2 | Mid | 0.844 | 0.649 | 0.496 | 0.226 | 0.076 | 0.022 |
| Purdue | 3 | East | 0.913 | 0.698 | 0.305 | 0.152 | 0.041 | 0.020 |
| Tennessee | 3 | South | 0.877 | 0.652 | 0.281 | 0.119 | 0.051 | 0.014 |
| Texas Tech | 3 | West | 0.83 | 0.634 | 0.250 | 0.087 | 0.036 | 0.013 |
| Houston | 5 | South | 0.83 | 0.429 | 0.172 | 0.078 | 0.037 | 0.012 |
| Illinois | 4 | South | 0.799 | 0.483 | 0.191 | 0.079 | 0.036 | 0.011 |
| UCLA | 4 | East | 0.844 | 0.642 | 0.287 | 0.121 | 0.030 | 0.009 |
| Iowa | 5 | Mid | 0.8 | 0.469 | 0.164 | 0.075 | 0.023 | 0.007 |
| UConn | 5 | West | 0.743 | 0.426 | 0.111 | 0.041 | 0.017 | 0.006 |
| Wisconsin | 3 | Mid | 0.68 | 0.415 | 0.151 | 0.050 | 0.013 | 0.004 |
| North Carolina | 8 | East | 0.776 | 0.251 | 0.095 | 0.028 | 0.010 | 0.003 |
| LSU | 6 | Mid | 0.72 | 0.362 | 0.144 | 0.046 | 0.011 | 0.003 |
| Saint Mary's | 5 | East | 0.617 | 0.200 | 0.076 | 0.027 | 0.008 | 0.003 |
| Texas | 6 | East | 0.669 | 0.194 | 0.083 | 0.030 | 0.007 | 0.003 |
| Murray State | 7 | East | 0.679 | 0.204 | 0.067 | 0.020 | 0.006 | 0.003 |
| Alabama | 6 | West | 0.684 | 0.225 | 0.071 | 0.016 | 0.005 | 0.002 |
| Arkansas | 4 | West | 0.593 | 0.328 | 0.073 | 0.024 | 0.008 | 0.002 |
| USC | 7 | Mid | 0.734 | 0.234 | 0.110 | 0.030 | 0.008 | 0.002 |
| Michigan | 11 | South | 0.497 | 0.171 | 0.057 | 0.013 | 0.005 | 0.002 |
| Michigan State | 7 | West | 0.63 | 0.154 | 0.050 | 0.013 | 0.004 | 0.001 |
| Boise State | 8 | West | 0.583 | 0.102 | 0.038 | 0.013 | 0.004 | 0.001 |
| Providence | 4 | Mid | 0.566 | 0.319 | 0.080 | 0.030 | 0.008 | 0.001 |
| Ohio State | 7 | South | 0.593 | 0.169 | 0.062 | 0.014 | 0.004 | 0.001 |
| Loyola Chicago | 10 | South | 0.407 | 0.132 | 0.048 | 0.012 | 0.004 | 0.001 |
| San Diego State | 8 | Mid | 0.659 | 0.154 | 0.063 | 0.024 | 0.006 | 0.001 |
| South Dakota State | 13 | Mid | 0.434 | 0.138 | 0.037 | 0.012 | 0.004 | 0.001 |
| Memphis | 9 | West | 0.417 | 0.074 | 0.030 | 0.009 | 0.003 | 0.001 |
| Indiana | 12 | East | 0.383 | 0.118 | 0.029 | 0.008 | 0.001 | 0.001 |
| New Mexico State | 12 | West | 0.257 | 0.105 | 0.017 | 0.005 | 0.001 | 0.001 |
| Vermont | 13 | West | 0.407 | 0.142 | 0.027 | 0.008 | 0.002 | 0 |
| Colorado State | 6 | South | 0.503 | 0.143 | 0.040 | 0.008 | 0.002 | 0 |
| Davidson | 10 | West | 0.37 | 0.099 | 0.027 | 0.006 | 0.002 | 0 |
| UAB | 12 | South | 0.17 | 0.066 | 0.017 | 0.004 | 0.002 | 0 |
| Notre Dame | 11 | West | 0.316 | 0.092 | 0.027 | 0.005 | 0.001 | 0 |
| Virginia Tech | 11 | East | 0.331 | 0.094 | 0.028 | 0.007 | 0.002 | 0 |
| Seton Hall | 8 | South | 0.697 | 0.136 | 0.029 | 0.006 | 0.002 | 0 |
| Iowa State | 11 | Mid | 0.28 | 0.126 | 0.032 | 0.007 | 0.001 | 0 |
| Creighton | 9 | Mid | 0.341 | 0.068 | 0.026 | 0.008 | 0.001 | 0 |
| Marquette | 9 | East | 0.224 | 0.055 | 0.016 | 0.002 | 0 | 0 |
| Montana State | 14 | West | 0.17 | 0.049 | 0.009 | 0.001 | 0 | 0 |
| Saint Peter's | 15 | East | 0.142 | 0.029 | 0.005 | 0.001 | 0 | 0 |
| Colgate | 14 | Mid | 0.32 | 0.097 | 0.029 | 0.007 | 0.002 | 0 |
| San Francisco | 10 | East | 0.321 | 0.094 | 0.028 | 0.007 | 0.001 | 0 |
| Richmond | 12 | Mid | 0.2 | 0.074 | 0.015 | 0.004 | 0.001 | 0 |
| TCU | 9 | South | 0.303 | 0.041 | 0.008 | 0.002 | 0.001 | 0 |
| Akron | 13 | East | 0.156 | 0.040 | 0.014 | 0.002 | 0 | 0 |
| Miami | 10 | Mid | 0.266 | 0.073 | 0.026 | 0.005 | 0 | 0 |
| Longwood | 14 | South | 0.123 | 0.034 | 0.006 | 0.001 | 0 | 0 |
| Chattanooga | 13 | South | 0.201 | 0.023 | 0.005 | 0.001 | 0 | 0 |
| Delaware | 15 | South | 0.114 | 0.021 | 0.005 | 0.001 | 0 | 0 |
| Norfolk State | 16 | East | 0.109 | 0.021 | 0.002 | 0.001 | 0 | 0 |
| Jacksonville State | 15 | Mid | 0.156 | 0.045 | 0.012 | 0.002 | 0 | 0 |
| Wright State | 16 | South | 0.094 | 0.026 | 0.003 | 0 | 0 | 0 |
| Texas Southern | 16 | Mid | 0.08 | 0.015 | 0.002 | 0 | 0 | 0 |
| Georgia State | 16 | West | 0.075 | 0.011 | 0.002 | 0 | 0 | 0 |
| Yale | 14 | East | 0.087 | 0.013 | 0.001 | 0 | 0 | 0 |
| CS Fullerton | 15 | West | 0.086 | 0.009 | 0 | 0 | 0 | 0 |