Tensions between players and NBA officials have been on the rise over the past couple years. In the 2016 – 2017 season, referees called 917 technical fouls, and in the 2017 – 2018 season that number increased to 946. Players and coaches are antagonizing referees more and more, forcing referees into handing out more technical fouls. On most occasions, a technical fouls is due to a player or coach letting their emotions get the best of them. Other times, the technical may have been drawn intentionally to send a message. When a technical foul is called, the opposing team is awarded a free throw, but the overall effect on the game doesn’t always end there. In this article, I investigate how technical fouls effect the game from the perspective of the teams involved and the officials. All of the data in this analysis came from basketball-reference.com.
When do most technical fouls occur?
As a first step, I looked at the game states in which technical fouls occur most frequently, separately for techs called on players / coaches. The following plots show the time remaining in the game and the point differential (from the point of view of the team that received the technical) for all technical fouls over the past two NBA seasons.
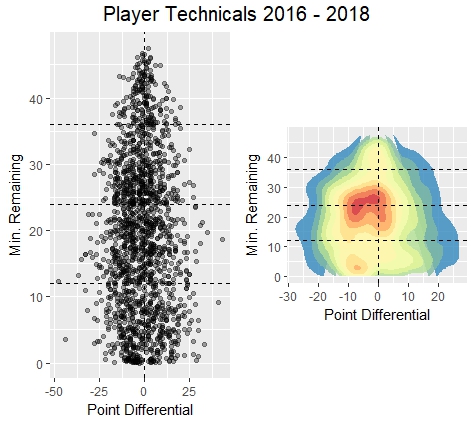
The horizontal lines on the charts reflect the end of quarters. It is evident from the heat map that technical fouls drawn by players occur most frequently at the end of the 2nd quarter when their team is losing by 0-10 points. This fits intuition, as players are undoubtedly more frustrated when they are loosing. There is also a smaller hot-spot at the very end of the game with a team is losing by 5-10 points. At this point in the game, the players have probably accepted the fact that they have lost and are willing to give the official a piece of their mind on how they feel the game was called.
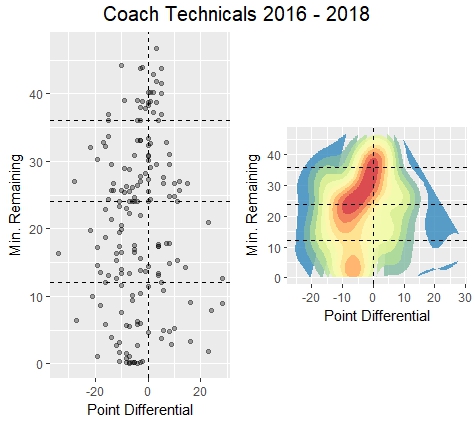
There are far fewer technical fouls called on coaches over the past two years, but we see a similar pattern to the player technicals: they are most likely to occur when a coach’s team is loosing in the 2nd quarter and at the very end of the game when victory is out of reach.
How do technical fouls effect the game?
When a referee gives out a technical foul, we often hear announcers proclaim that the technical will “send a message” or “fire up their guys.” I turned to the data to see how a technical can change a team’s performance, or change how the officials call the game. First, I compared how team’s perform in the three minutes before receiving the technical foul vs. the three minutes after receiving the technical. Technical fouls that occurred within the first/last three minutes of a game were excluded. I split the data by whether a player or coach received the technical and by whether the home or away team received the technical. The table below shows the average point differential in the three minutes before the technical and the average point differential in the three minutes after the technical for all the technical fouls in our sample. I used a t-test to generate a p-value to quantify how different these two samples are:
| Tech Type | Pt. Diff. in 3 Min Before | Pt. Diff. in 3 Min After | Diff | P-Value |
|---|---|---|---|---|
| All Technicals | -0.663 | -0.634 | 0.028 | 0.89 |
| Home Player Techs | -0.408 | -0.422 | -0.014 | 0.96 |
| Away Player Techs | -0.880 | -0.880 | 0.002 | 0.99 |
| Home Coach Techs | -0.788 | -0.038 | 0.750 | 0.48 |
| Away Coach Techs | -1.100 | -1.083 | 0.017 | 0.99 |
On average, the team that receives the technical foul has a point differential of 0.03 points better in the three minutes after the technical than in the three minutes before. More specifically, the biggest boost occurs when the home coach receives the technical. On average, their team’s point differential is 0.75 points better in the three minutes after the technical than the three minutes before. However, this difference isn’t statistically significant with a p-value of just 0.48. It is important to remember that the opposing team receives a free throw following a technical and this is included in the three minute stretch after the technical. If we were to exclude this free throw then the differences would be more pronounced! At the very least, it looks like teams receive enough of a short term “boost” from a technical foul to make up for the free throw that the other team was awarded.
The next aspect to investigate are non-technical foul calls. Is there a significant swing in how referees call games before a technical is given vs. after a technical is given? To answer this question, I pulled out the 10 foul calls before each technical as well as the 10 foul calls after each technical foul. The table below shows the average number of these 10 fouls that went in favor of the team that received the technical. Again the data is split by whether a player or coach received the technical and by whether the home or away team received the technical:
| Tech Type | Calls in Favor Before | Calls in Favor After | Diff | P-Value |
|---|---|---|---|---|
| All Technicals | 4.68 | 5.29 | 0.61 | <0.01 |
| Home Player Techs | 4.72 | 5.34 | 0.63 | <0.01 |
| Away Player Techs | 4.71 | 5.22 | 0.51 | <0.01 |
| Home Coach Techs | 4.73 | 5.31 | 0.58 | 0.07 |
| Away Coach Techs | 4.10 | 5.33 | 1.23 | <0.01 |
On average, teams receive 0.61 more calls in their favor (out of the 10 fouls) after a technical vs before the technical. This is a very significant difference! Whether they are aware of it or not, it looks like referees tend to make up for calling technical fouls by favoring the team that received the technical for the next short stretch of the game. Perhaps they are over correcting in their attempt to appear fair and unbiased. The biggest difference in favorable calls before the technical vs after is when the away coach receives the technical (1.23 avg. difference). This is somewhat counter-intuitive, as I would have expected the home team to benefit more due to the crowd noise also impacting the referee. Regardless of whether a player or coach or the home or away team receives the technical, we can expect that team to receive more favorable calls after the technical foul!
Finally, I took this analysis one step further to see if certain players generate more of a boost for their team or swing the officiating more by receiving a technical foul. Below is a table showing the before and after splits for point differential and foul calls for the players with the most technical fouls in my sample:
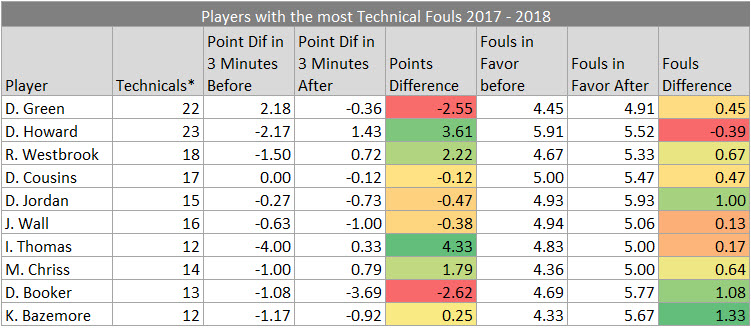 *Technical fouls that occurred within the first or final three minutes or didn’t have 10 foul calls before and after the technical are not included.
Dwight Howard and Isiah Thomas’s teams have the biggest turnaround in point differential after they receive a technical, while Devin Booker and Kent Bazemore have the largest effect on how future fouls called. Keep in mind that these are very small sample sizes and might not indicate anything more than random variation.
Conclusion
The data shows that there is a significant change in how a game is called before a technical foul vs. after (using our 10 foul window on either side of the technical). Teams that receive a technical tend to get more favorable treatment from the referees afterwards. It’s possible this is due to the players playing more aggressively and forcing more contact, but I think it is much more likely that referees are over correcting in an attempt to appear unbiased. This shift in officiating is also likely what causes teams that receive a technical to get a small boost in the three minutes following a technical (or, at least enough to make up for their opponent’s free throw attempt). Getting called for a technical foul might not be such a bad thing after all!