The 2016 tournament had good spots and bad – most notably Michigan State, whom my models ranked as the 1st/2nd best team in the field, but lost in their first game. Thankfully, there were some bright spots as well, led by Villanova, who was picked to win it all in only 2.5% of brackets submitted to ESPN, but my models had right up there with Michigan State as the 1st/2nd best team in the field. The sections below go into detail on some of the bigger hits and misses from the tournament as a whole, as well as the results for a few individual models.
Overview of Results
I use a handful of different models that each make predictions in their own way, and thus will not always generate the same probabilities for a given game (as I explained here). Ideally, most of the models agree with each other, but, when they differ, I trust the ones that have been most accurate in the past. From the table below, you can see there was a fairly narrow range of outcomes among the models, with all of them getting between 42 and 47 games correct (out of 67 total), or getting 63% – 70% of games correct. This performance was slightly lower than expected, as these models perform in the 85% – 88% range on previous games (as I explained in detail in this article).
| Number of Games Correct in 2016 (by Model, by Round) | |||||||
| Round | Model 1 | Model 2 | Model 3 | Model 4 | Model 5 | Model 6 | Model 7 |
| First Four | 3 | 4 | 3 | 3 | 3 | 3 | 3 |
| Rnd 1 | 21 | 22 | 22 | 22 | 21 | 21 | 20 |
| Rnd 2 | 9 | 10 | 11 | 11 | 11 | 13 | 11 |
| Rnd 3 | 4 | 4 | 5 | 6 | 7 | 6 | 7 |
| Rnd 4 | 2 | 2 | 2 | 2 | 2 | 1 | 2 |
| Rnd 5 | 2 | 2 | 2 | 2 | 2 | 2 | 2 |
| Rnd 6 | 1 | 1 | 1 | 0 | 1 | 0 | 1 |
| Total | 42 | 45 | 46 | 46 | 47 | 46 | 45 |
| Tot % | 63% | 67% | 69% | 69% | 70% | 69% | 69% |
2016 Misses:
- Oklahoma – None of my numbers had Oklahoma going far – most models predicted them losing to VCU in the second round or Texas-A&M in the third. Furthermore, the highest any of the models had them ranked was the 20th best team in the field.
- Notre Dame and Syracuse – If Michigan State, West Virginia, and/or Xavier had not gotten upset early, do either ND or Syracuse still make the Elite Eight? Doubtful. Nevertheless, a fair amount of my numbers had Michigan upsetting Notre Dame and/or Temple beating Syracuse the first round, so both teams were underestimated by my models.
- Middle Tennessee – Most of my models had Michigan State as the 1st-2nd best team in the field, with a 95-99% chance of winning beating Middle Tennessee (along with a spread of 18 points). Safe to say the models did not see this one coming.
2016 Hits:
- Villanova – there were a few models that ranked Villinova them as the best team in the field, and those that did not have them ranked first only had UNC, Michigan State, or Kansas above them. Relative to other rankings, models, and public perception, this was extremely high (only 6.5% of ESPN brackets had them in the championship game and 2.5% had them winning it all).
- Oregon – Similar to Villanova, Oregon was a popular pick to be upset early. However, almost all of my numbers had Oregon as the clear-cut #1 team out of their region, which they showed signs of before catching a red-hot Oklahoma team.
- Lower Seeded Teams – There were a number of first round games in which my numbers indicated that double-digit seeded teams had a great shot to win, if not be the outright favorite – among them were VCU (10 seed), Northern Iowa (11 seed), Gonzaga (11 seed), Arkansas Little Rock (12 seed), and Stephen F. Austin (14 seed), all of which won and covered the spread in the first round.
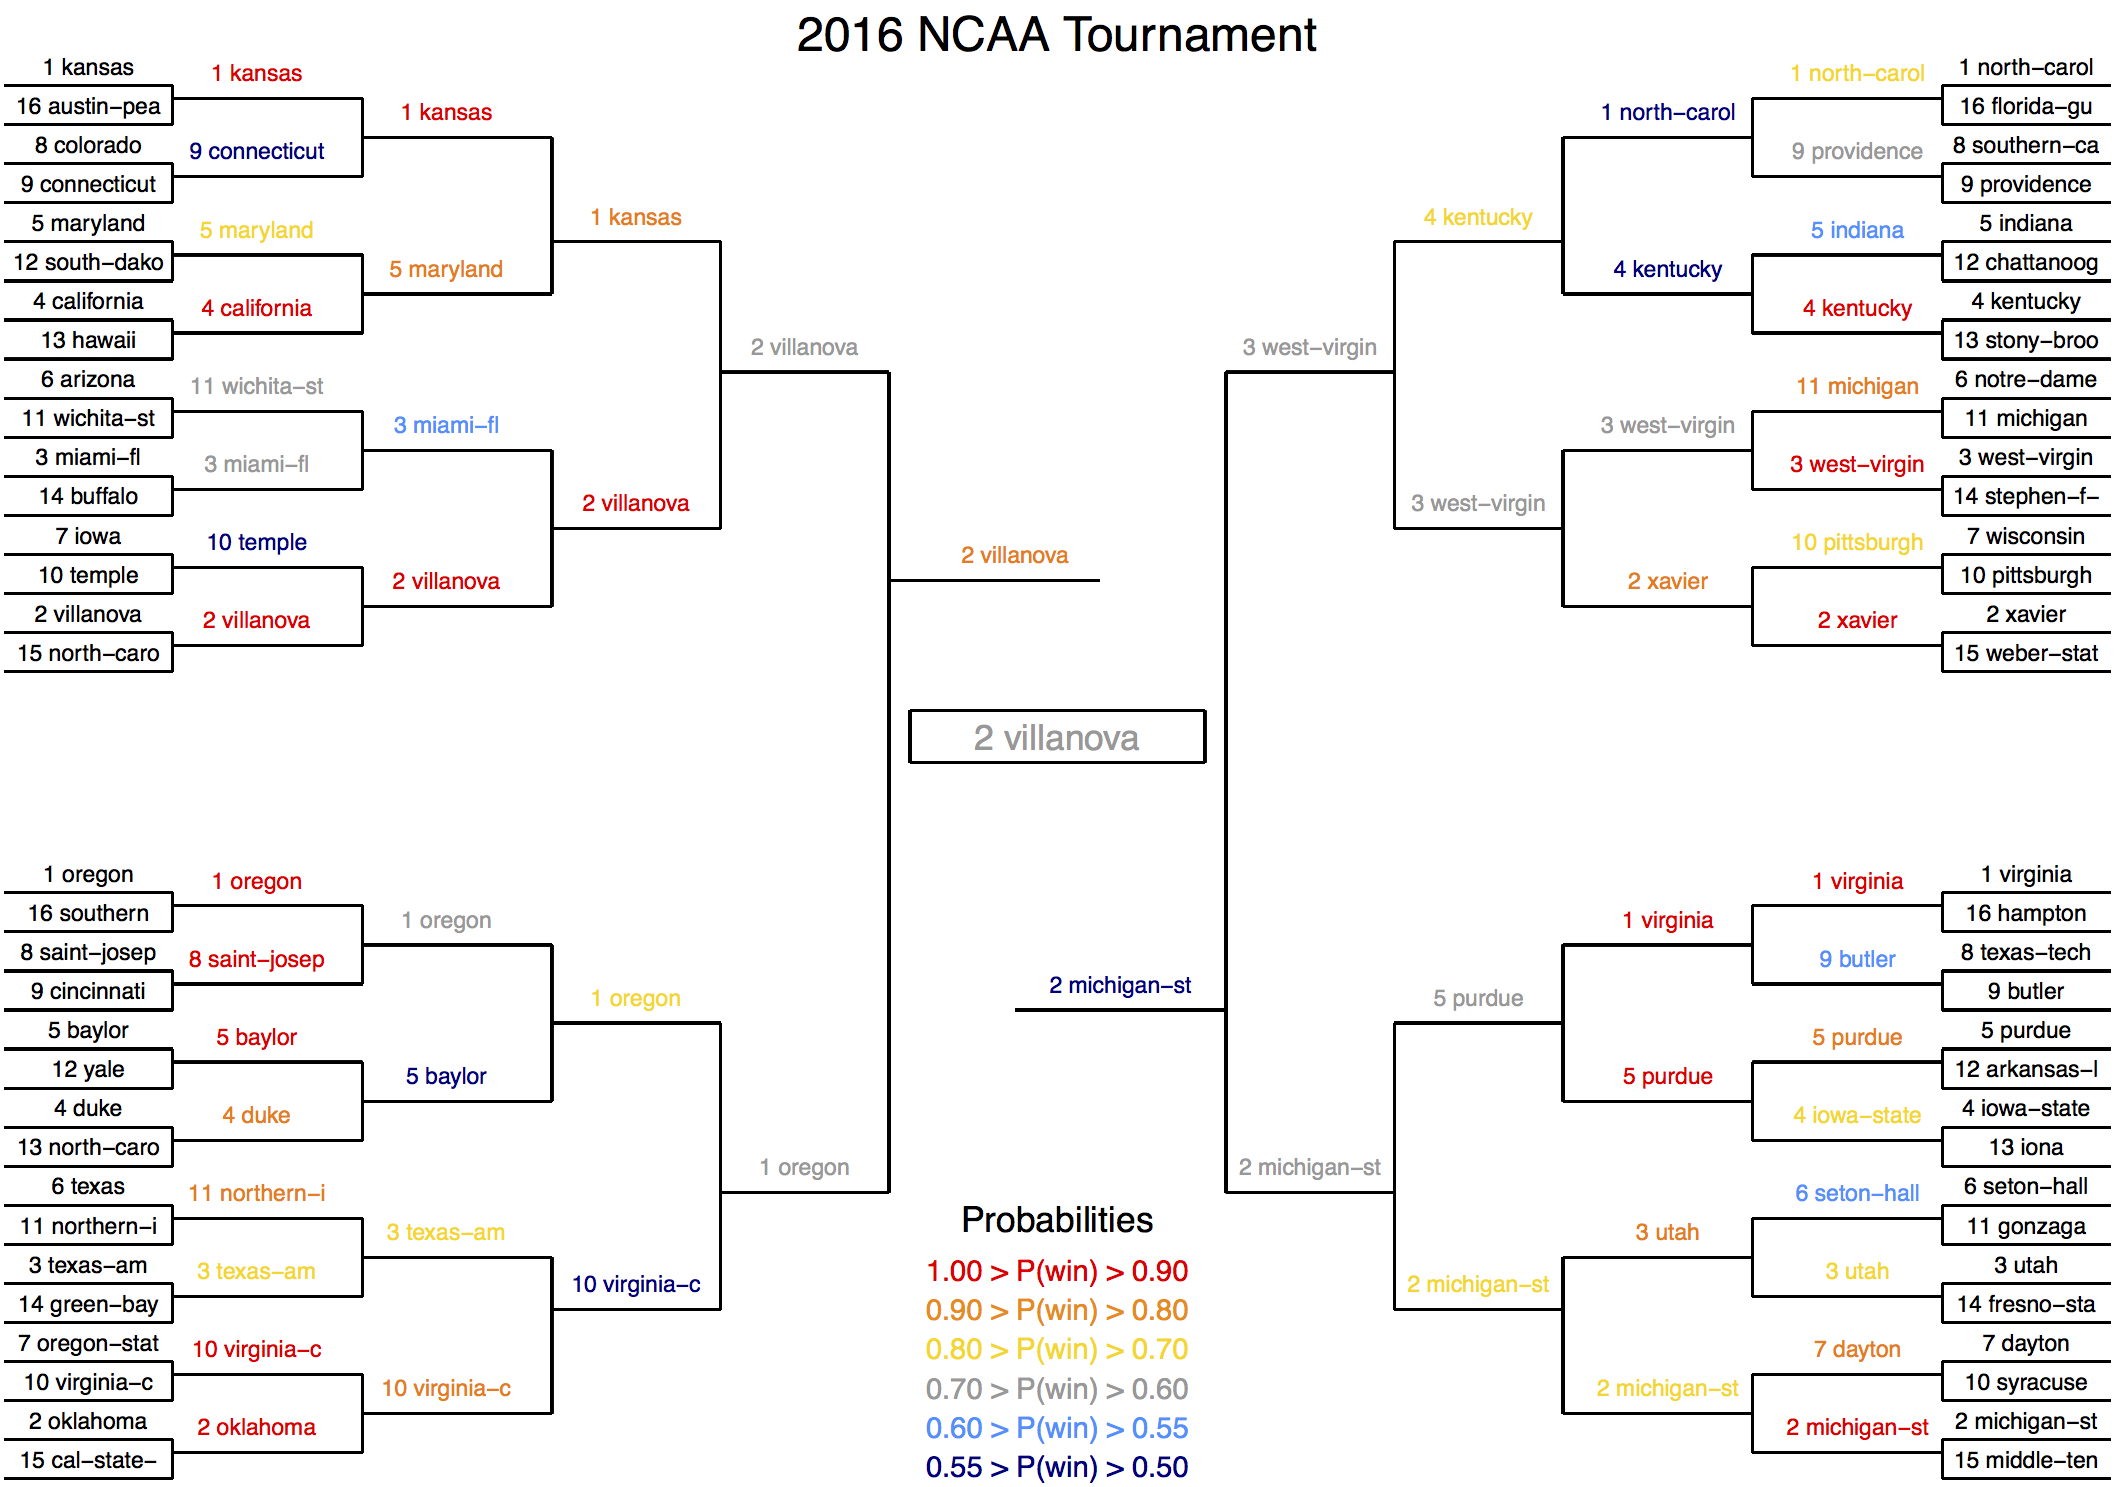
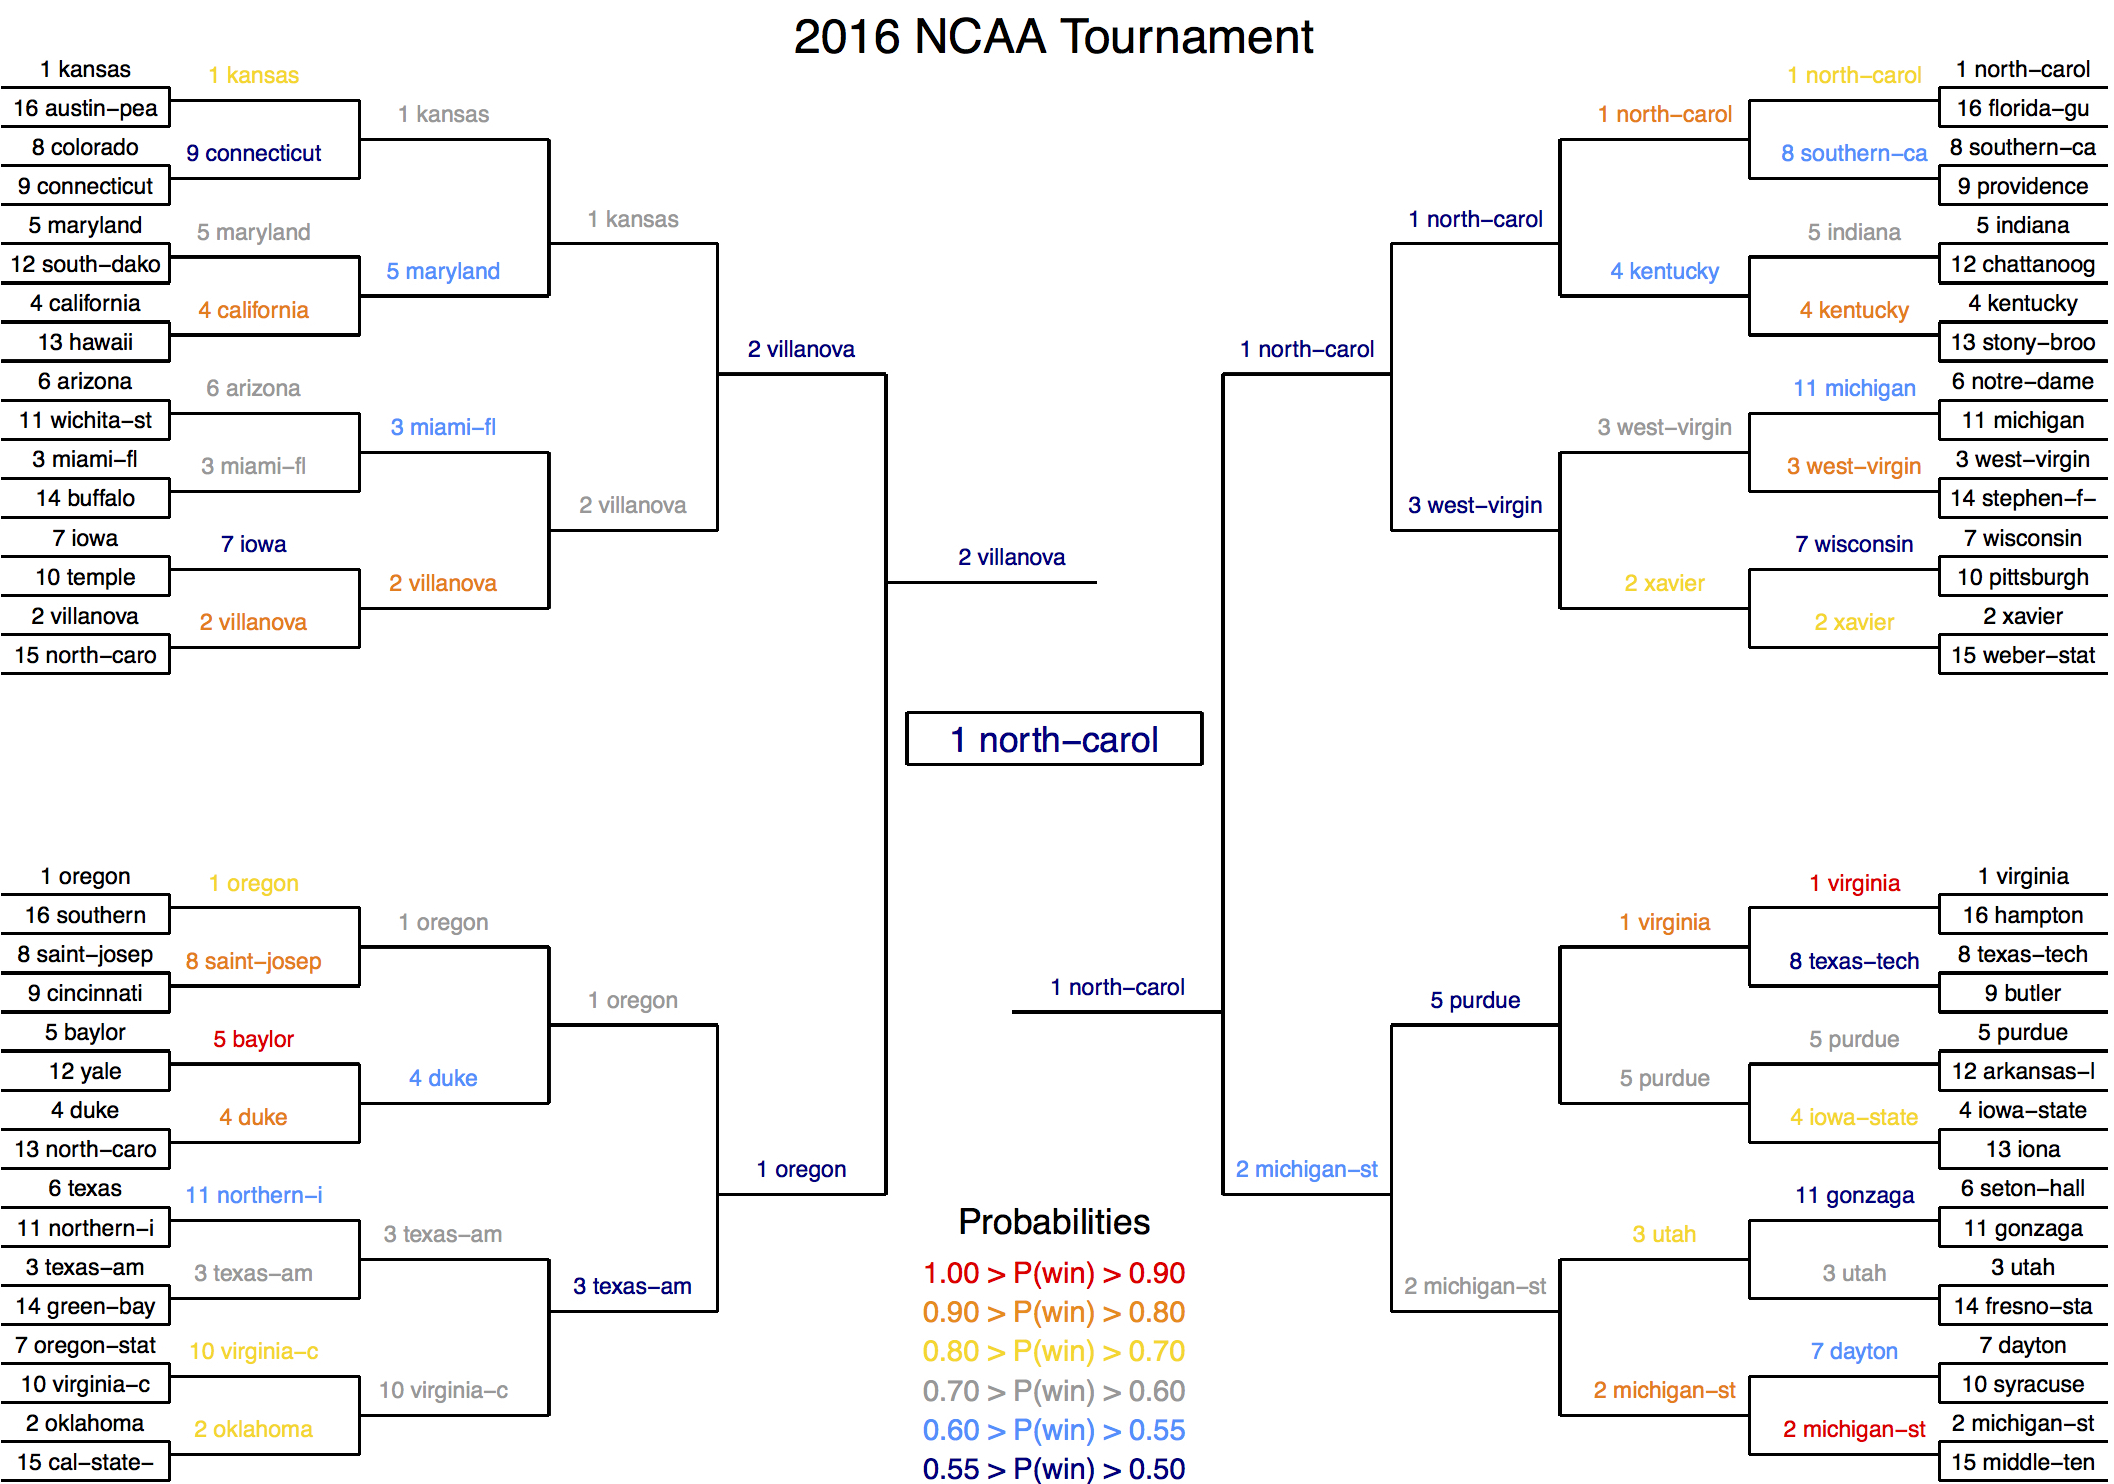
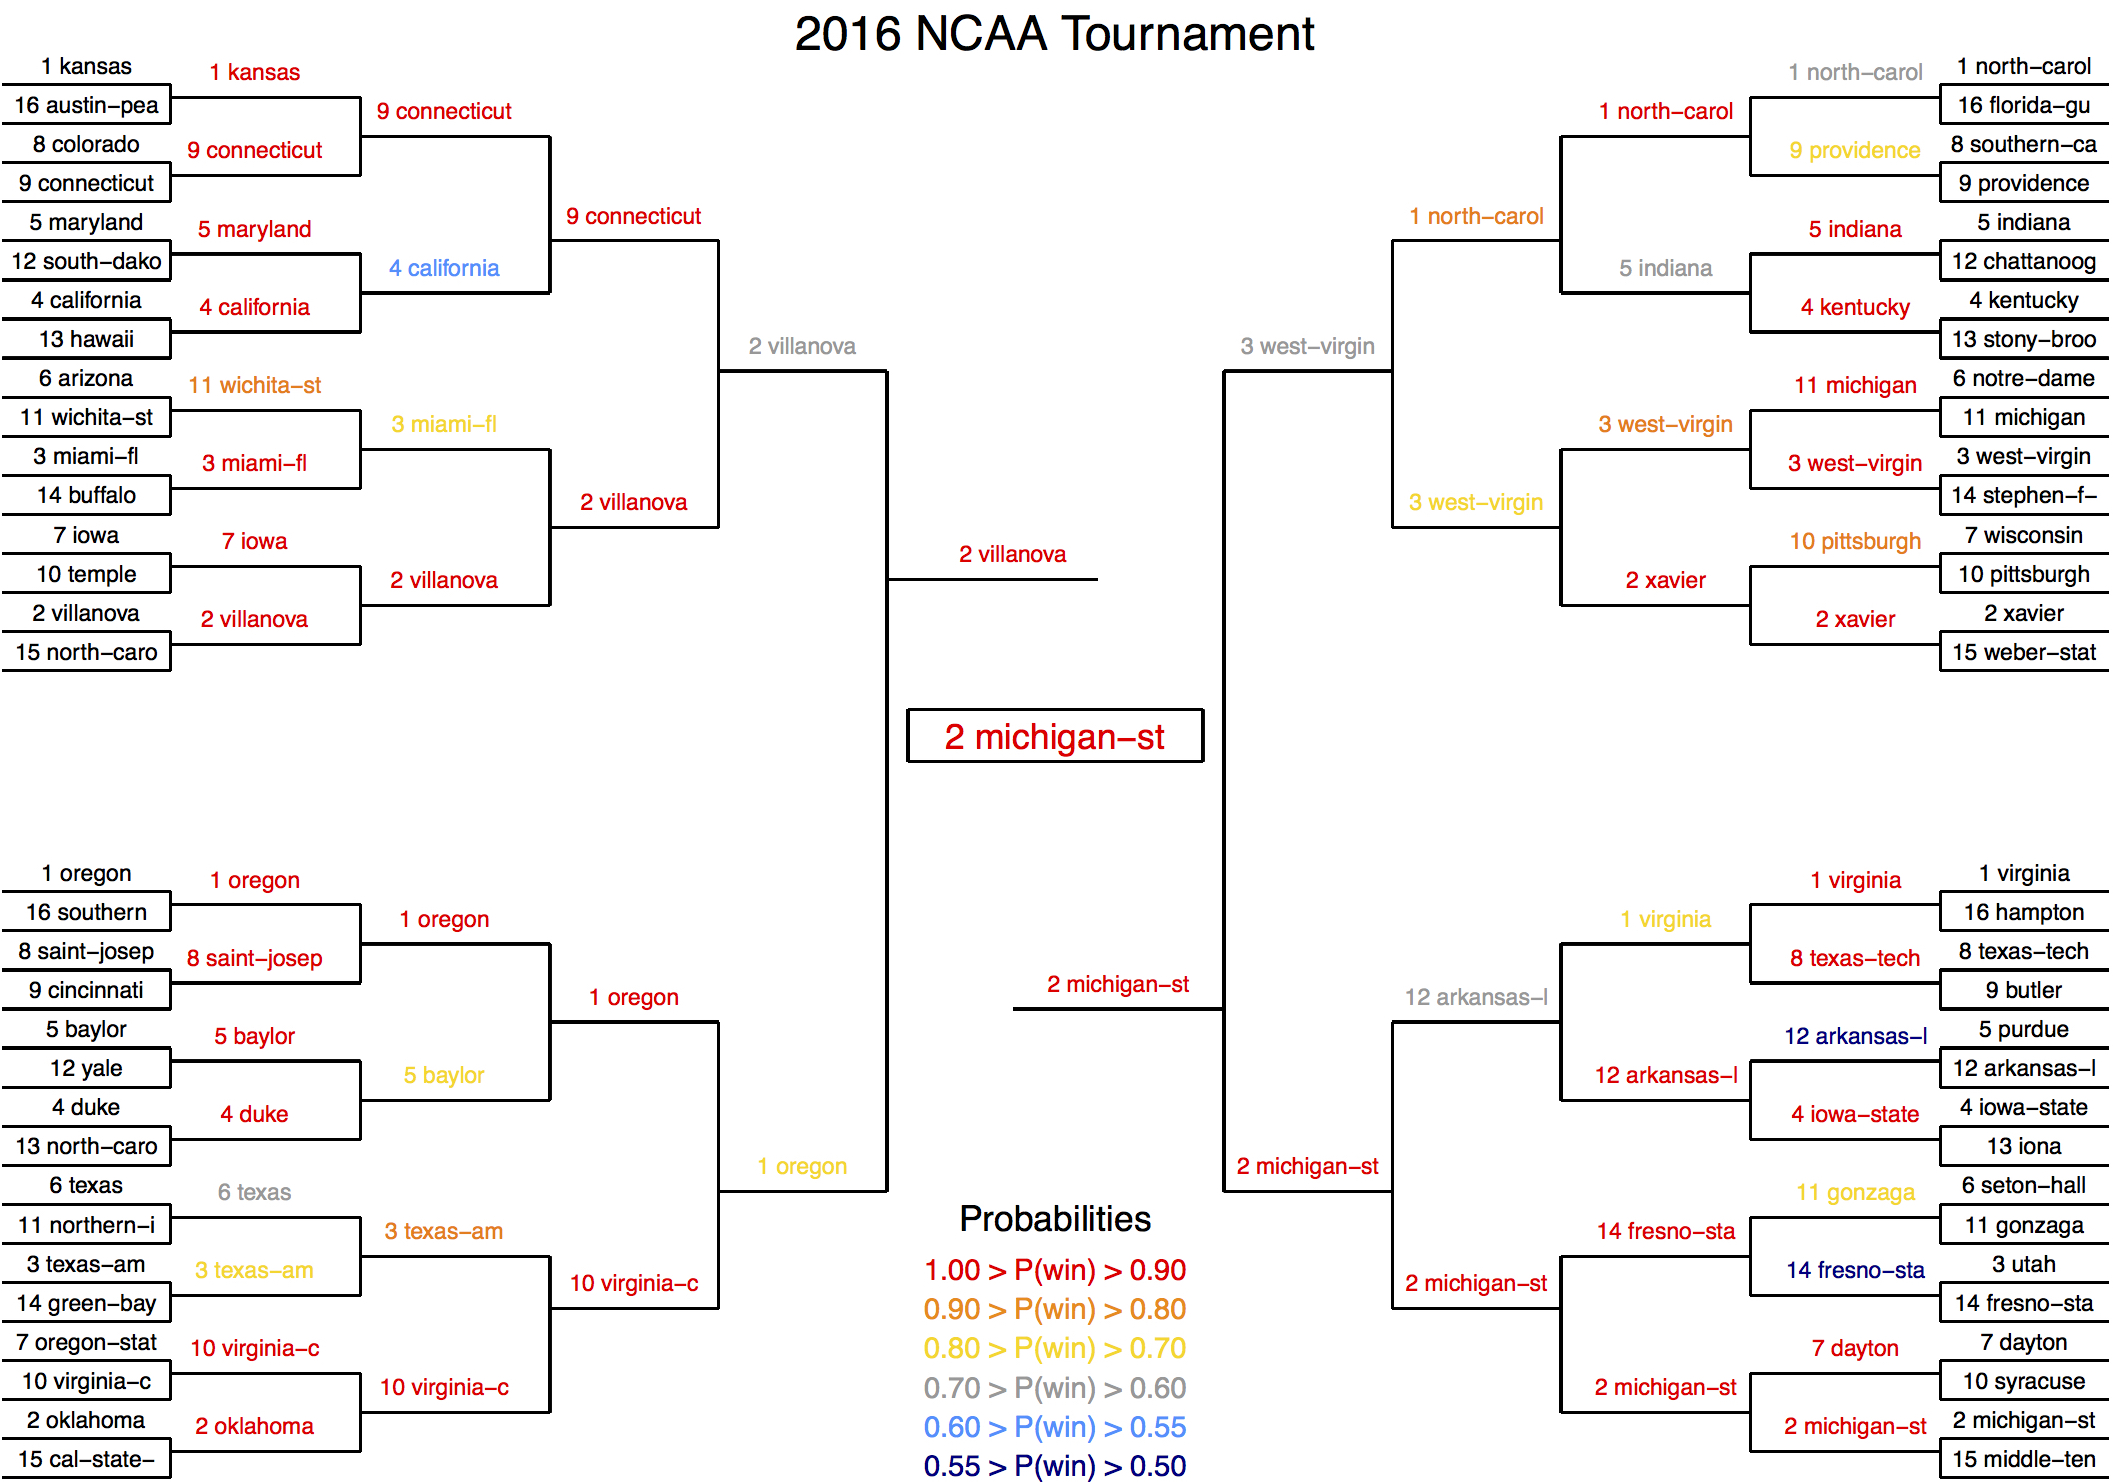
Full Bracket Predictions
The images below detail the entire tournament of predictions for three separate models. Every team that advances in these brackets is based on the model’s prediction for that given game (not the actual result), and teams are colored by their predicted win probabilities: